Impactstory Advisor of the Month: Keita Bando (November 2014)

Our November Impactstory Advisor of the Month is Keita Bando!

15101222975_5b920b542d_o.jpg

Keita is one of Japan’s best-known Open Access and altmetrics advocates. As a co-founder of MyOpenArchive (a precursor to Figshare), Keita’s been at the vanguard of scholarly communication for much of his career.

We chatted with Keita this week to learn more about his current Mendeley2ORCID project, his advisory roles at other scholcomm startups like Figshare and Mendeley, and his vision for what part librarians can play in helping researchers navigate the ever-expanding world of scholarly communication.

Tell us a bit about your role at MyOpenArchive.

Back in 2007, on the assumption that “there must be a host of unnamed research papers around the world,” we started MyOpenArchive, a web repository where you can post and share your academic works.

Here’s an example of why we started MyOpenArchive: peer-reviewed papers in journals and cited sources are only “a handful of jewels,” so to speak. But these jewels could potentially be found anywhere in academia: graduate school papers, internal research, and so on. Before we started MyOpenArchive, tons of knowledge could not be found outside of institutions. So we created a place where you can post and share all knowledge: MyOpenArchive.

We advocated for open access locally in Japan in the first three years of MyOpenArchive’s life [1][2][3], and in the latter three years we advocated internationally. [4][5][6] These six years of advocacy made substantial impact on researchers who hope to be more open and cited. We closed MyOpenArchive in 2013. [7]

Since the closing of MyOpenArchive, my primary role is an Open Access advocate at large.

Why did you initially decide to join Impactstory?

I encountered altmetrics around 2010. As an Open Access advocate, I support Jason Priem et al’s “altmetrics: a manifesto” and I am convinced that we can use altmetrics to change the open access movement.

I marveled to find how Total-Impact (now ImpactStory) and the Mendeley API-powered ReaderMeter work as altmetrics tools.

It is Total-Impact (ImpactStory) that inspired me to take part in the vanguard of open access, and to be engaged also as a Mendeley Advisor.

Why did you decide to become an Advisor?

Because I was absorbed in altmetrics as a concept, as a tool, and a community of research, I devoted myself to posting some of the first research on altmetrics in Japanese. Also I talked at academic institutional programs, including an event for librarians, and took part in several other open access advocacy events. [8][9][10]

So becoming an Impactstory Advisor was a natural fit, given my interests and advocacy.

I also volunteer my time to support Mendeley, figshare and ORCID as an advisor or an ambassador.[11]

All of my many advisory roles essentially represent my immersion in academic communications around open access and altmetrics. It has been my visiting card at public meetings, to be able to say that “As an advisor I consider altmetrics as…” and so on.

What’s your favorite Impactstory feature?

Above all, I love the T-shirt for advisors! (Look at the picture, please!) 🙂

Sorry, just kidding! (But I love it!)

I found the API-enabled, third-party integration features amazingly helpful. For instance, figshare, GitHub, slideshare are well-integrated with Impactstory.

I am particularly interested in Impactstory’s ORCID integration. Recently I posted on my personal blog how I love how well Mendeley, ORCID and ImpactStory are integrated. I was amazed that a lot of researchers found the post useful, and we had a good discussion.[12]

“Two things you have to do when you publish your academic work,” I suggested. “1. Manage the works you published and 2. Manage the altmetrics”.

First, register your publication on Mendeley. Next, add it on ORCID. But don’t waste your time by doing both manually. (As a researcher, you don’t have enough time, right?) We created Mendeley2ORCID so you don’t have to do it manually.[13] The service allows users to sync “My publications” on Mendeley to “My Works” on ORCID.[14]

It takes few minutes to sync, then you can sync ORCID to ImpactStory. Once you sync that, you can see how your research works’ altmetrics work.

One important thing to mention: works you add should have a DOI (or ArXiv ID, PubMed ID, etc). If you don’t have one, you can get a DOI by adding it to Figshare. Using a DOI makes it easy to measure social media impacts and citations.

The Mendeley2ORCID syncer is one reason I enjoy taking part in these four advisory/ambassador programs.

You blog and tweet a lot about changes in publishing, digital preservation, and open science. In your expert opinion, what’s the single biggest challenge facing scholarly communication today?

In general, scholars don’t have enough time for scholarly communication–I mean, time to learn how you can integrate several tools around.

First, there are literature management services like Mendeley and Readcube. Next, there are document collaboration services like writelatex. Then, you’ve got altmetrics services like Altmetric and ImpactStory. Furthermore, you’ve got PeerJ and eLife as OA journals, figshare as a repository and also ORCID.

These scholarly communication tools need some kind of instructors. I suggest librarians and research administrators could be lead instructors. Scholars and research administrators could work together, joining forces to enter the emerging era of scholarly communication. Because a great deal of academic web services are born and fade all the time, it’s hard to keep track of how we can share our academic publications.

That is the long-term vision I hope to make happen. At least we could change how librarians help with scholarly communication tools.

ImpactStory is the key when you enter the emerging era of scholarly communication.

Thanks, Keita!

As a token of our appreciation for Keita’s outreach efforts, we’re sending him an Impactstory t-shirt of his choice from our Zazzle store.

Keita is just one part of a growing community of Impactstory Advisors. Want to join the ranks of some of the Web’s most cutting-edge researchers and librarians? Apply to be an Advisor today!

Impact Challenge Day 11: Social media automation for academics

SOCIAL MEDIA(3).png

You’ve now got seven social media accounts, including your blog. How can you possibly find time to manage all these accounts, given the time demands of the average academic?

Today, we’re going to talk about how you can use social media automation tools like Buffer and IFTTT to manage these accounts in a more efficient way.

Below, we’ll introduce you to how social media automation works, the best automation tools, and rules to follow for success.

What is social media automation?

When you want to share a new blog post or article link on social media, you can save time by using a single tool to post to Twitter, Facebook, and LinkedIn all at once. These tools will allow you to compose one message and post it to all your connected social media accounts with the click of a button or whenever a “trigger” is tripped. That’s social media automation, and it’s going to save you a ton of time.

Many social media automation tools can also be used to schedule posts in advance, so you can plan ahead to share a lot of content over the course of a day or week, rather than all at once.

Cyborgs vs. robots: your best options for automation

There are two types of social media automation tools:

Cyborgs

First are composing and sharing platforms, which we’ll call “cyborgs” because they require some human input to automate future actions. Buffer and Hootsuite are in this category (we’ll talk about both of these below).

In general, here’s how cyborg tools work: you log on to the platform, compose a message to share, select the social media accounts you want to share the message on, and then schedule the message to post at a later time. Cyborgs are more hands-on, but they allow for superior control of messaging and timing.

Robots

Your other option is full-blown automators, which we’ll call “robots” due to the fact that they automate posting not based on human input but instead based on whether or not certain actions have occurred on the platforms they’re connected to. IFTTT is in this category (again, more on IFTTT below).

When using a robot tool, you first define and set up actions you want to automate–say, “if I post a new blog post, then I’ll share a link and the title of the post automatically on Twitter and Facebook.” Then, whenever you complete that action, the robot will do its work, immediately automating posts across various social media sites. In general, robots’ big drawback is that you don’t have much control over what’s automatically posted and when, but they do save you time and effort by not requiring human intervention in order to work.

All of the tools we’ll cover below tend to post to Facebook, Twitter, and LinkedIn out-of-the-box. All also have a flaw: they don’t let you automate posts to or from ResearchGate, Academia.edu, or Google Scholar. Below, we’ll introduce some workarounds that address this problem. But first, let’s check out the most popular automation tools one by one.

Buffer

Screen Shot 2014-11-12 at 12.52.10 PM.png

Buffer is a popular, browser-based, “cyborg” social media automation platform. On the free tier of the service, you can connect and post to your Twitter, LinkedIn, and Facebook accounts from a single update box (seen above).

To get started, sign up for an account and connect the social media accounts you want to post to. On the Content tab, you’ll see a blank update box. This is where you’ll compose your message.

First, select the networks you want to post to; then, compose your message (a “remaining character” limits appear to the left of the “Add to queue” button), add a link, and add a photo (click the camera icon on the bottom left of the update box, and Buffer will guide you through selecting and adding a photo to the post).

Screen Shot 2014-11-12 at 11.50.44 AM.png

When you’ve finished composing your message, you can either add the post to your queue to be shared at a time that Buffer selects, share the post immediately, or schedule the post to appear at a time that you specify.

Screen Shot 2014-11-12 at 11.53.35 AM.png

You can also customize the times at which Buffer will share items in your Queue. Click on the Schedule tab, select the days of the week you want Buffer to share content, and then add the times of day (and night) you want Buffer to share content.

Hootsuite

Screen Shot 2014-11-12 at 12.16.41 PM.png

Hootsuite is another popular “cyborg” social media automation platform. You can both schedule posts on the service and monitor interactions across your profiles via its Stream interface, pictured above. We’ll focus on Hootsuite’s post automation features below.

To get started, sign up for a Hootsuite account and connect up to three of your social media profiles for free (perfect if you’re just connecting your Twitter, LinkedIn, and Facebook accounts).

Screen Shot 2014-11-12 at 12.46.34 PM.png

To compose a message, hover over the “Send to” box at the top left of your screen. The box will automatically expand to show you the full composition and posting options.

Screen Shot 2014-11-12 at 12.54.37 PM.png

When you’ve finished composing your message, you can choose to “Send now” or click the calendar icon to schedule your post for the future (“Schedule” menu seen at right).

If you choose to schedule ahead, note that you can either specify a time and date for your post, or allow the post to be added to the AutoSchedule. AutoSchedule works like the Buffer Queue: it will post your message at predetermined time and dates that you can adjust by clicking the gear icon on the AutoSchedule box of the “Schedule” menu.

OK, we’ve covered your options for automating part of your social media routine with cyborgs. Let’s talk about what robots can do for you. 🙂

IFTTT

Screen Shot 2014-11-12 at 1.03.12 PM.png

IFTTT (“If this, then that”) is a powerful “robot” automation platform. Here’s how it works: you create a Recipe, select the Trigger, and define an Action you want to automatically happen once that Trigger is tripped. In the example pictured above, I’ve told IFTTT that anytime a new post appears in Carl Boettiger’s blog’s RSS stream (Trigger), to send me an email (Action).

You can reuse others’ Recipes that will post to Twitter, Facebook, and LinkedIn anytime you’ve written a new blog post; cross-post from one social network to another, so your LinkedIn posts automatically appear on Twitter and Facebook and vice versa; tweet when you’ve created a GitHub repository; and so on.

To create your own Recipes, sign up for IFTTT, click “My Recipes” at the top of the page, and click “Create a Recipe”.

Click “this” to define your Trigger. Search for your Trigger Channel–the platform that you want your data or updates to come from. Then, choose the Trigger–the event that will initiate the Action. For example, if I want to post to Facebook anytime I tweet a link on Twitter, my Trigger Channel is Twitter, my Trigger is “New link by you.”

Screen Shot 2014-11-12 at 1.35.43 PM.png

Define your Action next. Click “that” to search for your Action Channel–the platform where you want your data or updates to appear. Then, select the Action itself–the event that will happen when your Trigger occurs. You’ll be prompted to define what text you want to appear in your Action, using “Ingredients” from the Trigger (click the Erlenmeyer flask icon to see what Ingredients are available).

Screen Shot 2014-11-12 at 1.36.52 PM.png

Continuing with our above example, my Action Channel is Facebook, and my Action will be “Create a status message” on Facebook, and the text that will appear in the status message will be the “Text” Ingredient from my Twitter update.

Select the Ingredient, click “Add ingredient,” click “Create Action,” then click “Create Recipe” to set your automated Facebook posts into effect.

IFTTT offers more than 4000 Trigger and Action Channels, so the possibilities for automation are endless (and a bit overwhelming). Start out small–one or two Recipes, tops–and test how your audience receives them before automating more content sharing.

There aren’t very many options for automating actions when new content is posted to ResearchGate, Academia.edu, or Google Scholar, as I mentioned above. That’s due to the fact that none of these services have APIs. (If you think that should change–we do!–you can contact all three companies via webform to let them know. ResearchGateAcademia.eduGoogle Scholar)

But there are workarounds: you can adapt or create Recipes that post your most popular Academia.edu papers to Facebook each week, tweet when a new publication is added to your Google Scholar profile, update your LinkedIn profile whenever a new PubMed item from a saved search appears, and so on.

Built-in automation tools

Though ResearchGate and Academia.edu aren’t connectable to IFTTT, Buffer, or Hootsuite, you can use their built-in automation tools to post updates whenever you add a paper to either platform.

Screen Shot 2014-11-12 at 3.18.50 PM.png

On ResearchGate, add a new publication and then head to the publication’s page. Beneath the basic article information at the top of your profile, you’ll see a button to “Share” your article on LinkedIn, Facebook, Twitter and other social networks. Click on the service you want to share your article to, and you’ll be prompted to connect your profile and share the post.

Screen Shot 2014-11-12 at 2.57.33 PM.png

On Academia.edu, add your Twitter handle on your profile homepage. Whenever you add a new paper, you’ll be prompted to tweet about your upload.

Ingredients for successful social media automation

There are some general best practices you should abide by when automating your social media streams to optimize your efficiency and avoid inadvertently coming across as a spammer.

Pay attention to formatting and medium when posting across multiple platforms

Twitter, Facebook, and LinkedIn all have different limits on the lengths of content that can be shared in a single message. If you’ve got a message that is better communicated in a long post, try posting separate messages to Twitter and to Facebook and LinkedIn.

(Carefully) Schedule ahead

Consider automating your sharing for maximum reach and engagement. For example, some content gets more clicks, comments, and shares if posted on the weekend or late at night. You could schedule your posts to appear during those times, and also test other times to see if they’re better for your audience. (More on that below.)

Automation can be great for sharing links to posters, slides, and comments while you’re presenting at conferences. Postdoc Ross Mounce used automation to announce that he was presenting while he was on stage. Research scientist (and Impactstory Advisor) Keith Bradnam used automation to tweet a pre-recorded video related to a presentation he was giving, while he was giving it. You can also share blog posts that you’ve written in advance when you’re on holiday, at busy times in the semester, and other times when you don’t have time to post to social media.

If you do schedule ahead, be prepared to hit “pause” if major events happen. Otherwise, you can come across as insensitive. One example to learn from is Guy Kawasaki, who was criticized for keeping his social media automation running while the Boston Marathon bombing unfolded in 2013. Imagine if your automation made it appear as though you were trying to promote your work during a similar catastrophe!

Don’t automate interactions

Some like to automatically tweet “Hello!” to new followers, or reply with a standard message to those who tweet at them. Both of these tactics detract from the reason you’re on social media–to be social! Automated interactions can be a missed opportunity to learn about new followers or engage in discussions. Rather than automating interactions, save time by setting aside a half hour or so on a weekly basis to batch your replies.

Find the best times and content types to post for your audience

You’ll want to post when your followers are most likely to read and interact with your posts and articles in the form of shares, retweets, clicks, comments, and so on. In general, there are ideal times and days to post to various social networks, but you should learn what’s best for your specific audience.

The Buffer blog suggests that you consider the following when determining your social media automation schedule:

  1. What time zones are the majority of your Twitter followers located? (We recommend Tweriod to learn when your followers are online.)
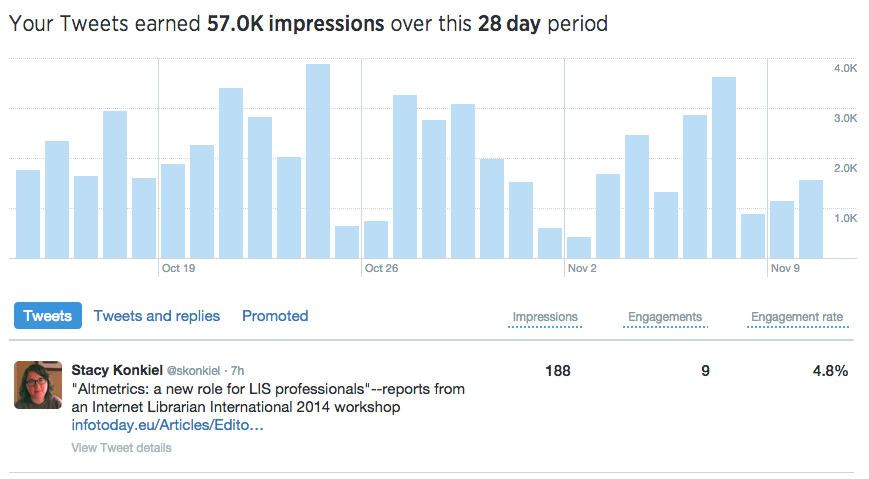
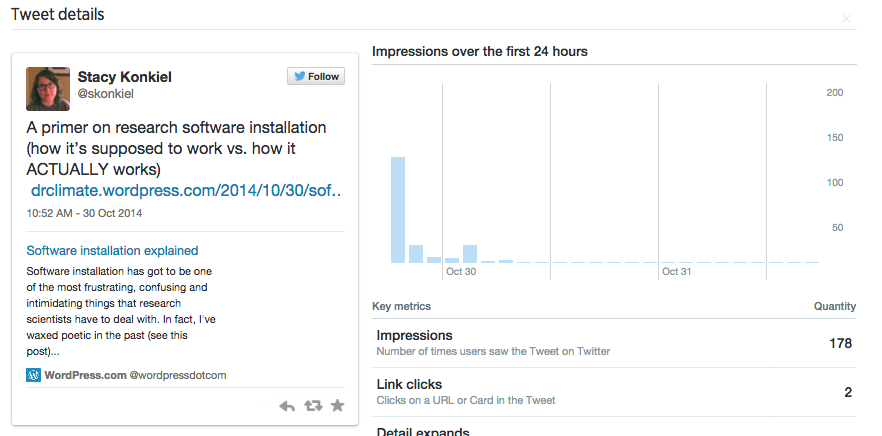
  2. When do your posts most often get clicked and shared? (Experiment with posting the same content on different days and at different times, then use built-in analytics tools for Facebook, Twitter and LinkedIn to see which date and time performs best.)
  3. When are you around to respond to interactions with your content? (You know your own schedule best, so consider posting the content that’s likely to be most discussion-inducing when you’re awake and around to respond to comments.)

Also experiment with what you’re posting to learn what resonates more with your audience. Do more people read your articles when you’ve posted them to your blog and shared those links, rather than links to the articles themselves? Are your colleagues more likely to strike up a discussion if you post questions when sharing content? Again, share the same content multiple times but in different formats to learn more about what your followers are most likely to read, discuss, and share.

Homework

Your homework is to sign up for and test Buffer, Hootsuite, and IFTTT. Which one(s) work best for you and why?

Once you’ve figured out which one you prefer, create a plan for how using it will fit into your social media schedule, and how you’ll test the popularity of posting times and types of content. Then, start automating!

Finally, read this LSE Impact Blog post on automating measurement and collection of your social media impact. You don’t have to enact any of the suggestions from the post, but keep in mind that it’s possible to backup all of your impacts to Google Drive. It may be useful for you down the road.

In tomorrow’s Impact Challenge, we’re switching gears: we’ll explore platforms for sharing your research data.

Impact Challenge Day 10: Explore using Facebook in a professional context

Facebook is the social network that needs no introduction: it’s got 1.3 billion users, and chances are most everyone you know is on it. Yet over 50% of scientists say they won’t use it professionally.

On the surface, Facebook doesn’t seem good for academia because it doesn’t make sense to promote our work to our friends and family, or to blur the boundaries between our personal and professional lives.

But Facebook networks are as good as you make them, and Facebook allows us to make more personal connections to colleagues than academic social networking sites do. And for those who research topics that are the subject of public discussion–for example, stem cell research, climate change, or Ebola–Facebook can be a good way to share your research with audiences outside the Ivory Tower.

In today’s challenge, we’re going to take a “pros and cons” approach to exploring how Facebook might be useful to your career.

Reasons to use Facebook professionally

Many of us are on Facebook, and plenty of us do “friend” our colleagues on the site, even if we’re not on Facebook primarily for professional reasons.

Scientists who do use Facebook for professional reasons tend to use it to promote their work, and as an informal way to network with other scientists.

Using Facebook to promote your publications, news, and awards

Screen Shot 2014-11-12 at 6.46.48 PM.png

Consider sharing a link to one of your articles, a bit of news, or an award announcement the next time you log on to Facebook. One advantage to sharing articles in particular is that Facebook-based sharing and discussion has been linked to increased readership.

In a recent Nature survey, 15% of scientists that are regular Facebook users promote their recent publications on the site, and over 20% use it to post work-related content. And in a separate study, one researcher opined, “‘I find that blogging/Facebook can be a very good way to make one’s research more widely known to other scientists, the public and, very importantly, students (both to inform them and to recruit!).”

Who’s most likely to share their work on the site? Well, the most often shared papers on Facebook tend to be those in the biomedical and health sciences, but there’s not yet research on the extent to which these papers were shared by the authors themselves.

Here are some tips for sharing your research on Facebook:

  • Ideal times to post are reportedly after the workday is over (5 pm – 1 am), when your friends have more time to click on the links you post.
  • Include a photo, figure, or video–visual content gets more “likes” and shares on Facebook than plaintext and links alone do. And more shares means more potential readers for your article.
  • If you didn’t publish in an Open Access journal, link to an Open Access version of your article hosted on Figshare, Impactstory, etc, so others without access to the journal you’ve published in can read it.
  • Keep your post’s introductory text to 40 characters or less–more people will “like” and comment upon your post, and that means your post will appear more often in others’ timelines, increasing your potential readers.
  • If you’re sharing research that might be of public interest, set your post to “Public” (more information on how to do so in today’s Homework, below) and use hashtags related to the subject of your study, so people browsing news on the subject can more easily find your post. Here’s an example of news articles and updates discovered by the “#Ebola” hashtag.

Using Facebook to expand your network

In researching this blog post, I was surprised to find that some researchers use Facebook to network. But the Tanya Golash-Boza recommends doing just that:

“Facebook is also a networking tool, particularly for taking advantage of “weak ties.” Recently, I wanted to meet the author of a successful book to ask her some questions about publishing. I looked her up on Facebook and discovered that we had two friends in common. I emailed one of them and asked for an introduction. Two days later, we were in direct email contact. As another example, in the past year, I have several received lecture invitations from Facebook friends. My constant virtual presence in their lives likely increased the likelihood they would invite me to speak.”

The informal, passive route to networking worked in Golash-Boza’s favor, but note that she didn’t “friend” or message someone she didn’t know in order to make a connection–she leveraged shared ties instead (something you practiced during our LinkedIn challenge). Some researchers are very against using Facebook in a professional manner, so tread carefully.

Reasons not to use Facebook professionally

Facebook censors your newsfeed

As we saw from Facebook’s recent suppression of Ferguson-related news in the US, Facebook’s algorithms might decide that your updates aren’t worth sharing with your network. So, why share your research or your views on a platform that might hit the mute button on you?

Facebook has privacy problems

Facebook is a for-profit corporation. They make money by selling your personal data to advertisers (in addition to putting advertisements onto your Facebook profile and allowing brands to use your “likes” in their advertisements). They also have run afoul of privacy advocates by constantly changing the default privacy settings for profiles, opening up new and established users alike to unwanted public exposure.

If you do choose to use Facebook in a professional manner, be aware of the privacy issues and the steps you can take to mitigate them.

Your network is only as “professional” as you make it

You might use Facebook only for personal updates, sharing photos of your children or what you made for dinner last night. Sure, you can change your Facebook privacy settings to hide unprofessional content from colleagues. But doing that for each new friend you add can be a bothersome process. Some prefer to not friend colleagues at all, for that very reason.

Homework

Is Facebook right for you, professionally speaking? Take some time to think on the arguments presented above and decide for yourself whether you want to use Facebook to network with other scientists, share your publications, or to facilitate your research.

If you decide you want to use Facebook in a professional context, here’s how to make sure it’s up to snuff:

  • Create a “list” for everyone you’d consider a professional contact, and remember to add future professional contacts to that list, as you become Facebook friends.
  • Edit your privacy settings so you’re discoverable (click the privacy settings padlock in the upper-right of your profile, click “Who can contact me?”, and select “Everyone” under “Who can send me friend requests?”)
  • Further edit your privacy settings so new updates are not shared with your professional contacts by default–this can keep you from accidentally sharing something inappropriate with the wrong audience. (Privacy settings > “Who can see my stuff?” > “Who can see my future posts?”, select the group(s) you want to share all of your posts with)
  • Whenever you share something that’s of professional interest, be sure to share it with both your work colleagues and your other “friends” on the site. Consider even making it visible to the public. (On the status update box, click the audience button to the left of the “Post” button and choose the lists you want to share that update with.)

In tomorrow’s challenge, we’ll tackle social media automation–making it simple and quick for you to update your Twitter, Facebook, and LinkedIn accounts from a single interface. See you then!

Impact Challenge Day 9: find your community on Twitter

The next two days of the Impact Challenge will cover the biggest social media platforms on the planet: Twitter and Facebook.

Twitter is a microblogging site with 560 million active users, and more than 1 in 40 researchers are reportedly active on the site.

Scientists who use Twitter tend to be effusive in their praise: Twitter helps them stay on top of news in their field, find new publications, get speaking and publishing opportunities, communicate their research directly to the public, and–perhaps most importantly–find a sense of community. In fact, among researchers who use social media in a professional context, 83% declared Twitter to be the most useful tool they use.

Today, we’ll explore Twitter’s usefulness for you. We’ll get you onto the site, engaging others, finding the best sources of information in your field, and measuring the diffusion of your research among other researchers and the public.

Sign up

Screen Shot 2014-11-10 at 3.39.50 PM.png

Creating a Twitter account is dead simple: logon to Twitter.com and sign up for an account.

On the next screen, you’ll be prompted by Twitter to choose a handle–make it similar to your blog handle or your name, so your professional “brand” matches across platforms.

Complete the rest of the setup steps–find other users to follow and connect your email account to import other contacts–then head to your email to confirm your account.

All done? Now it’s time to do the important stuff.

Personalize your account

Screen Shot 2014-11-10 at 3.42.49 PM.png

First, add a photo to your “avatar” by clicking the blue camera icon in the upper left-hand corner, next to your name. Make it simple by adding the same photo that you used for LinkedIn or your website; it’s easy change if you want to add another photo in the future.

Next, add a short bio. This is your chance to explain who you are in 160 characters or less. LSE Impact Blog recommends stating your experience and research interests, university or organizational affiliation, and a link to your blog. We also recommend adding a few hashtags (more on those in a moment) that can connect you to other users with similar interests across the platform. For example, I’ve added “#libraries #altmetrics #craftbeer” to my bio.

To add your bio, click on your username beside your avatar and on your profile page, click the “Edit Profile” button the right-hand side of your profile. There, you can add your bio and a link to your blog or website.

Got your basic account set up? Now it’s time to start engaging with other scientists and the public.

Find people to follow

Twitter users share research articles, news, and tidbits about their lives on a daily basis. Your next step is to find users who share your interests and to “follow” them to start receiving their updates.

Twitter tries to make it as easy as possible for you to find other people to follow via the “Who to Follow” panel on the righthand side of your profile, seen above. Their recommendations are usually either spot on (you can see above they’ve suggested OpenScience for me) or completely off the mark (they suggested WomensHealthMag to me based only on the fact that I’m female and that I selected “Health” as one of my interests upon signing up–under the mistaken assumption that “Health” = “Healthcare”). The more people you follow, though, the better their system gets at finding you new suggestions. Click on the “View all” link in the “Who to follow” panel to get a long list of suggested users.

Another great way to find people to follow is to search Twitter for particular interests. From any page on Twitter, type a keyword into the Search box at the upper right-hand corner of the page. On the results page, click “People” in the left-hand navigation bar to narrow the results to Twitter users who match your interest.

You can see here that I’ve searched for the term “bioinformatics” and narrowed the results to include Twitter users who match that term:

Screen Shot 2014-11-10 at 4.10.02 PM.png

Read through the search results, keeping an eye out for familiar names and interesting bios. When you find a user you want updates from, click the “Follow” button to the right of their bio. Now, when you’re on your homepage you’ll see their recent updates:

Screen Shot 2014-11-10 at 4.11.38 PM.png

There are several other good ways to find people to follow:

  • Take a look at who others are following (on their profile, click “Following”) and follow them,
  • Find curated Twitter Lists on the profiles of those you follow, like these lists for Scientists and STEM Academics (click “Lists” on their profile pages, then scan the lists they’ve created to find ones relevant to your area of research), and
  • Watch the updates on your Twitter homepage for unfamiliar names–chances are that someone has “retweeted” (shared someone else’s update with their audience) a user that you’d be interested in getting updates from.

Try to follow at least twenty colleagues and organizations in your field to begin with, and take some time to read through each user’s “timeline” (updates on their profile page) to learn more about them and their interests. You’re going to start chatting with your colleagues in our next step.

Making connections on Twitter

Now we get into the meat of the challenge: making connections with others in your field.

One of the things that makes Twitter so great is that it is a no-pressure forum to spark conversations with your colleagues about a variety of topics, including but not limited to your shared area of study. Twitter also helps you find members of the public who are interested in your area of study.

Researchers who participated in a recent study of academics’ use of social media reportedly appreciate Twitter because:

  • ‘Love the ability to chat to colleagues on Twitter, better than seeing each other just once a year at conferences and actually I have “met” people on Twitter before meeting them IRL at conference.’
  • ‘My focus is science outreach to general audiences. These formats [Facebook, Twitter, Storify] are easy to use and my audiences are there. It helps me disseminate information about science, science news and the process of science to broader audiences.’
  • ‘Twitter allows me to make connections to folks that I would not otherwise have – journalists, policy professionals.’

You’re going to engage with others by tweeting at them–writing short messages that either respond to one of their updates, ask questions, or share information with them. Let’s talk now about what makes for good “tweeting.”

Basics of composing a tweet

Tweets are the 140 character messages that users compose to update others on a variety of things: their opinions on a study, recent news, a thought-provoking blog post, and so on. You can write anything in your updates, and attach photos and location information, too.

Some things you might want to share with others include:

  • recent papers in your field (both papers you’ve written and others’ articles)
  • news and blog posts relevant to your discipline (science policy, funding announcements, articles from Nature News, New Scientist, the Impactstory blog, and your other favorite sources of information)
  • your opinion on developments in your field, others’ research, and so on (don’t be afraid to (respectfully) rock the boat)
  • a funny thing that happened in your lab, at a conference, or in the classroom
  • happenings from your personal life (are you enjoying your vacation? Did you meet a wallaby for the first time in your life? Are you proud of your most recent 5k race time?)

No matter what you tweet about, there are some basic things you can do to make your tweets more interesting to others (and thus more likely to be shared via a retweet):

  • use hashtags (a word or phrase that follows the “#” sign, like “#scicomm” or “#tenure”)
  • attach a photo to your tweet (when composing a tweet, click the “Add photo” camera icon and upload a picture from your computer),
  • consider following the 5-3-2 rule: social media experts recommend that for every 10 updates you post, 5 should be content from others that are relevant to your followers, 3 should be professional content, and 2 should be personal updates

When in doubt, just remember to keep it professional and you can’t really go wrong.

Tweeting at conferences

Now that you’re tweeting, let’s explore some of the benefits (and drawbacks) to tweeting at conferences.

Some academics swear by tweeting at conferences, because it provides an easy way to learn new things and meet new people by following and participating in conversations. As Bik & Goldstein explain,

Tweeting from conferences (discussing cutting-edge research developments, linking to journal articles or lab websites, e.g., …) can introduce other scientists to valuable content, and consequently provide networking opportunities for users who actively post during meetings…Journalists and scientists following a conference tweet stream may be additionally introduced to new groups of researchers (particularly early-career scientists or those scientists who are new to Twitter) with relevant and related interests; conference tweeting can thus serve to enhance in-person networking opportunities by expanding these activities to online spheres.

Further, Jonathan Lawson points out that it allows students and early career researchers, in particular, to participate in a “backchannel” that’s not dominated by the most established researchers, like the conferences themselves sometimes are.

Screen Shot 2014-11-10 at 5.42.08 PM.png

The next time you’re attending a conference, find out what the meeting’s hashtag is, and then search for and follow it to “listen in” on the conversation. (We searched for and followed tweets for #EuroSciPy, at right.) A popular way to follow conference hashtags is TweetChat, which filters out the non-conference tweets in your timeline, making conference-related tweets easier to follow.

And when you’re ready to participate, you can add your voice by writing tweets that include the conference hashtag. When you’re listening to a talk, summarize the main points for your followers, add your own commentary to the speaker’s, and share related papers and websites. Just make sure you have the presenters’ permission to tweet about their talk; some would prefer to keep their findings off the internet until they have published on them.

You can also tweet using the conference hashtag to organize informal “tweetups”, which can help build relationships and ward off boredom in unfamiliar cities (“Invigorated after Stodden’s great keynote! Anyone up for grabbing a coffee before the reception to talk about it? #meeting2014”).

For more “how to’s” on conference tweeting, check out SouthernFriedScience’s primer on tweeting at conferences.

Measuring your success

Screen Shot 2014-11-10 at 5.50.49 PM.png

Twitter’s new Analytics dashboard can help you measure the success of your outreach efforts.

Logon to Twitter Analytics and review your latest tweets that share links to your blog or your papers. On the dashboard view (pictured above), you’ll see all of your tweets and a summary of your impressions and engagements.

The number of impressions are time your tweets appeared on someone’s timelines. The number of engagements are the number of times your tweets have been retweeted, clicked through, or clicked on to learn more information about what you shared. They help you measure the amount of exposure you’re receiving and others’ interest in what you’re tweeting, respectively.

The dashboard view is good at summarizing your impressions and engagements over various time periods. The default view is for the past 28 days, but you can click the calendar button in the upper right hand corner to select a date range of your choosing–useful if you want to see what effect tweeting at a conference had upon the amount of exposure you’re getting, for example.

To see the drill-down engagement metrics for a specific tweet, click on the tweet. You’ll see something like this:

Screen Shot 2014-11-10 at 6.02.31 PM.png

In addition to simple engagement and impression metrics, LSE Impact Blog also recommends recording the following:

At the end of each month, Twitter can be used as a painless metric to assess how your tweeting is working for you and your project. Showing the growth in your followers and the number of people who read your research blog can also be helpful for funding applications. You could make short notes on the following:

    • The number of followers you have
    • The names of those who could be useful for future collaboration
    • Invitations to write blog posts or speak at events, which have come via Twitter
    • Number of hits to your own blog posts via Twitter

Over time, you can build upon what you’ve learned from your Twitter metrics, tweeting more content that your followers will love, in a manner that will engage them the most.

Limitations

Twitter is, like many of the other platforms we’ve covered so far, a for-profit company. Though it’s technically free to use, you pay for your account by allowing Twitter show ads in your timeline and access and sell your personal data to other companies.

Twitter has also recently announced plans to experiment with users’ timelines, meaning that the uncensored, time-based updates you see on your homescreen could soon be replaced with updates selected by an algorithm. That’s something that Facebook currently does, and it led to a near blackout on updates for its users about one of the biggest news items of the year in the US: the Ferguson protests.

What could it mean for you? Well, if Twitter’s future algorithms inadvertently decide that your tweets about H1N1 studies or field research or science funding aren’t compelling to your users, it could remove them from others’ homepages, killing potential conversations and connections.

Homework

For today’s homework, you’re going to find other researchers to engage and begin tweeting in earnest.

We recommend following 20 people to begin with, adding a few each day using the techniques described above (keyword searches, Twitter lists, and following researchers that your colleagues are following). Aim to follow at least 100 people by the end of the month.

In the next few days, as you start to get a few followers, take some time to learn more about them. Using the Twitter Analytics “Followers” dashboard, check out their interests, what countries your followers are tweeting from, and who else they’re following–this can be a great source of new people to follow!

Finally, commit to tweeting at least 20 times over the next week. It will help populate your timeline, which will make others more likely to follow you. Share at least one of your own blog posts, one of your articles, and engage someone else in conversation.

If tweeting that often seems like a lot–don’t worry! The day after next, we’ll show you how to automate your social media updates using tools like Buffer and Tweetdeck. But first, we’ll cover whether using Facebook in a professional context is right for you during tomorrow’s Impact Challenge.

Impact Challenge Day 8: promote your research with Kudos

So far we’ve covered several ways to promote your work among your colleagues, but how can you better promote your work to the public?

The public is increasingly interested in the results of taxpayer-funded research, and the government agencies who fund you want to know your “broader impacts”. What can you do about it?  Getting your work in front of those who understand what you do can be difficult enough; how can you expect laypeople to see it and, more importantly, to “get it”?

Nowadays, there are a lot of platforms available that can help you promote your work. One of your options is Kudos. Kudos is a for-profit company built to help researchers explain their studies to both the public and others in their field. And yet, its customers aren’t authors but publishers.

Kudos’ customer list includes both toll-access and open access publishers, including eLife, Elsevier, the Royal Society of Chemistry. Publishers pay Kudos to get access to premium features for their authors. But anyone can sign up for free and use Kudos’ basic promotion and analytics tools to learn if others are reading and discussing their work online.

Today, we’ll help you check out Kudos as a tool for promoting your papers. Let’s dig in.

Sign up for an account

Head to growkudos.com and click the “Register” button in the upper right-hand corner. On the next screen, add as much professional information as possible, including your ORCID ID–this will help Kudos automatically find your articles in the next step. When you’ve entered all your information, click the green “Sign up” button, and then login to your email to confirm your account.

Claim your publications

Screen Shot 2014-11-09 at 4.02.57 PM.png

Next, Kudos will list publications it believes to be yours. Add them to your profile by clicking the green button beside each title. If you make a mistake, you can always “unclaim” the paper by clicking the button again.

If any of your publications are missing, you can search for them by title or by adding a DOI.

Are all of your papers added? Great, let’s move on.

Explain your publications

Now, we get to the useful part of Kudos’ platform: explaining your articles.

All of the following steps will help those outside of your field better understand your research and why it’s important. This is an important but time-intensive part of the outreach process. So, you’ll likely just want to do the following for three or four of your papers that you need the most help promoting to the public.

Short title

Some paper titles can end up being long and jargon-filled. Adding a short title can help make your paper more discoverable by others in your field and beyond.

When writing your short title, try to strike a balance between phrases that your target audience will search for and phrases that are easy for your those outside of your core audience to understand. The LSE Impact Blog recommends “a full ‘narrative title’ that clearly summarizes the substance of what the article argues or what has been found out.”

So, this title (“Quindolinocryptotackieine: the elucidation of a novel indoloquinoline alkaloid structure through the use of computer-assisted structure elucidation and 2D NMR”) might end up looking more like this (“A computer-aided exploration of a new indoloquinoline alkaloid structure, quindolinocryptotackieine”) when shortened.

Lay summary

This is your chance to explain the study in detail, with public engagement in mind. Why does your research matter, and where does it fit in the bigger picture? Overall, try to avoid jargon, keep your sentences simple, and answer the question that’s inevitably in your readers’ heads: “What’s in it for me?”

More information on writing lay summaries can be found on the Digital Curation Centre and Asthma UK websites.

Impact statement

Kudos describes the Impact Statement section as “an explanation of what is most unique and/or timely about your work, and what difference it might make.” This is your chance to go into more detail about why your study was worth publishing about. How did it expand upon previous studies? What problems did it solve for the world? How might your readers’ lives be affected by the outcome?

Add links to supplemental materials and rich media

If you have figures, a video, or any other type of supplemental material, add links to each paper in this step. Creating these backlinks can help up your papers’ ranking in search results, and those supplemental materials can help your readers better understand your papers.

Share your papers

Next, you’re going to share your papers with your colleagues and the public.

On your publication page, click the green “Share now” button in the middle of the page. You’ll next be prompted to post your paper to Twitter, Facebook, or elsewhere online using a special Kudos URL that includes a tracking code. The code will help you measure how often that link to your paper has been clicked on, which in turn will measure the effectiveness of Kudos’ outreach mechanisms.

If you want to share your paper to Twitter and Facebook, connect those services to Kudos. If you’d prefer to share it via email, on your shiny new blog, or elsewhere on the Web, choose the “Share Online” option and then select what kind of trackable URL you want to use.

Measure the success of your outreach

In addition to the trackable Kudos URL that you’ve now shared on the Web, you can discover the level of attention your work has received overall via Kudos’ integration with Altmetric.com.

Here’s how to access your metrics: on any page for your publications, click on the blue “Publication Metrics” button to see a table of your articles and the attention they’ve received online. There are two types of metrics you can see on this table: Kudos-specific metrics and Altmetric.com-powered metrics.

Screen Shot 2014-11-09 at 6.37.57 PM.png

Kudos metrics

Kudos reports the number of share referrals, Kudos views, click throughs, and full-text downloads your paper has received. These metrics really only tell you about the success of promoting your paper on Kudos–they’re unable to tell you how often your paper has been shared using other links and DOIs.

Nonetheless, Kudos users do find these metrics useful–they helped this scientist see a definite bump in full-text downloads after he claimed one of his papers.

Altmetric.com metrics

These metrics can tell you about the attention your work has received on the Web overall–to a limited extent. Currently, Kudos lists the Altmetric.com score–a weighted sum of your news coverage, blog posts, Twitter mentions, and other online shares and mentions your work has received.

We’re not big fans of this score because the exact weights are not published, making it difficult to interpret. A better option is to click the “More Details” icon to the immediate right of  any of your papers’ titles to drill-down into what specific types of attention your article has received online. That said, the score can be used with caution to get a quick overview of which of your articles are getting more online attention than others. We’ll talk more later in the Impact Challenge about how to get more useful, in-depth, and transparent metrics of impact from Altmetric.com, Impactstory, and other sources.

Limitations

While Kudos makes it easy to claim papers, other features are more time consuming. The biggest drawback is the amount of time needed to write short titles, lay summaries, and impact statements for each of your articles.

There’s no way around it–you’ll have to put in some serious thought to write ‘em, and that translates to a lot of time. So, you’ll likely want to only write those titles, summaries, and impact statements for the papers you most want to have public exposure.

We also have reservations about the Kudos business model. It has pros and cons, for sure: it’s free to researchers (pro), but it’s primarily supported by publishers’ money, which means that researchers’ needs may not always be their top priority (con).

Another con is that in the Kudos model, promotion of publishers’ content becomes a responsibility of the authors, rather than publishers’ marketing teams. That said, your promotion efforts also help you, and Kudos provides a solid framework to guide you–a definite pro.

Homework

You may have noticed the number of big fat “X”s that I currently have on my Kudos Author Dashboard:

Screen Shot 2014-11-09 at 6.37.57 PM.png

That’s Kudos’ way of telling me what promotion and outreach steps remain for my papers.

Your homework is to get at least three of your papers that you think might garner the most public interest onto Kudos, and to turn most of your “X”s into check marks. If you don’t yet have a Twitter or use your Facebook account professionally, that’s fine–just be sure to share your paper via email and blog about it. You’re also welcome to share a Kudos link to one or more of your papers in the comments below.

As for Twitter and using Facebook professionally–those are your two next challenges. See you back here tomorrow!

Updated 11/11/14: edited to explain how to find drill-down metrics for Altmetric.com score.

Impact Challenge Day 7: Establish your expertise with a science blog

Screen Shot 2014-11-09 at 10.14.05 AM.png

In today’s challenge, we’ll create a virtual watercooler for you to meet colleagues and debate research in your field. How? On your very own blog!

A blog can help you establish expertise, forge new intellectual bonds in your discipline, and give you a place to test out new ideas and promote your research. And it’s surprisingly easy to maintain if you set it up right.

Let’s get cracking!

Choose a platform

First things first: let’s pick the technology you’ll use to blog.

One popular option is WordPress. WordPress comes in both open source and hosted flavors. If you use the former, you’ll have complete control over the look and feel of your blog, but also the responsibility for installing and maintaining the code on your website. The latter is better for those who aren’t as technically inclined or who worry less about the ability to control their blog’s appearance. For either option, WordPress offers an easy-to-use editing interface, solid analytics, and well-designed themes and plugins.

The Jekyll platform is a cult favorite that’s used by many tech-savvy, GitHub-lovin’ academics. It offers near-infinite flexibility of design, the ability to write posts in Markdown, and easy installation for those already on GitHub Pages. It doesn’t come with analytics out of the box, though, so you’ll have to install a separate plugin for Google Analytics. For a full guide to setting up Jekyll, check out this Smashing Magazine piece.

Two other blogging platforms are popular among academics: Medium and Tumblr. Both are free to use. Medium is very easy to setup, offers a sleek design, and helps promote your posts among other Medium readers. The latter feature means that you won’t necessarily have control over what posts are promoted on your blog, however, which is a drawback.

Tumblr is similarly simple to set up, offers a more customizable design than Medium, and is well-suited for image-based research blogging–appealing to informaticists who use data visualizations, those who want to blog about figures, and so on. A downside of the platform is that it’s most popular with teens and early twenty-somethings, so it could be difficult to find a community of established scientists on the platform.

You might be wondering, “Where’s the Blogger recommendation?” While Blogger is an out-of-the-box blogging platform that’s similar to WordPress in many ways, in my opinion it doesn’t offer the flexibility of design, easy website integration and domain name registration, or usability that WordPress does. That said, it is used by prolific academic bloggers like Jonathan Eisen and Tanya Golash-Boza. You’re welcome to test it out for yourself!

Once you’ve chosen your platform, go ahead and set up your blog. Here are some tips for doing so:

  • You’ll have to register for a blog handle if you’re using WordPress, Blogger or Tumblr (yourhandle.blogspot.com/). If you don’t have a catchy blog title in mind, feel free to choose your name–it’ll help people find you!
  • If you’d prefer to have a catchy name for your blog, brainstorm some ideas. Some fun and informative blog handles I like are “Pharyngula,” “Freakonometrics,” and “Thread & Circuits.”
  • Create the look and feel you want for your blog, choosing a theme for your WordPress or Jekyll blog that matches your tastes. You might also consider choosing a theme based on its SEO-optimization.

Got your blog set up and ready to roll? Now it’s time to decide what you’re going to write.

Possible uses for your blog

There are a few ways that academics tend use their blogs: to publicize their own work, to discuss others’ research, or some combination of the two. Here are some examples.

Spreading the word about your research

Screen Shot 2014-11-09 at 10.15.39 AM.png

Jonathan Eisen is famous for (among other reasons) using his blog to spread the word about his own research.

Back in 2011, he published a paper in PLOS ONE. Normally, academics will use their university’s press office to explain their publications’ significance to the media and the public; Eisen decided he wanted to tell the story of his study himself. So, he took to his blog.

The study picked up a lot of press coverage (including the The Economist and New Scientist), received more views and altmetrics compared to other PLOS ONE papers published in the same discipline and year, and–best of all–allowed the person who was best acquainted with the research to talk about it with the world.

Another option is to blog about your in-progress work. Blogs are excellent for engagement, and can be useful to get feedback from your peers on challenging problems or new ways to view your results. Be careful not to scoop yourself, though–if you plan to formally publish on a study, you might consider waiting on reporting your final results.

Commenting on others’ research

Screen Shot 2014-11-09 at 10.16.13 AM.png

Many academics use their blogs as a form of post-publication peer review, offering their feedback on recent publications in their field.

Rosie Redfield is among the most famous to do so, having written a stellar take-down of the over-hyped “arsenic life” paper that was published in 2010. Her blog allowed her to respond to the article within days of its publication. (Compare that to the two years it took for her formal response article to be published!) That speed, along with the fact that she can engage rapidly and often with her readers via the blog’s comments section, makes blogging an excellent forum for post-publication peer review.

What else can you do with your blog?

You can use it for advocacy, editorializing, and event promotion, among many other things. The sky’s the limit!

Decide on a posting schedule and stick to it

Got an idea of what you want to blog about? Now it’s time to figure out how you’re going to blog.

Many “blogging for beginners” guides recommend setting a posting schedule for yourself. That can be once a week, once a month, or however often you can manage.

Why do you want a schedule? Regular posts are key to having an audience that’ll return to your blog. And having a framework to work from keeps you organized in the rest of your life.

Key to finding a schedule that works for you is having realistic expectations about the amount of time it’ll take you to research and write a blog post. And that will depend upon what you’ve decided to blog about.

Write one or two posts to start out with, timing how long it takes for each. (You can expect that number to go down over time, as you get better at writing more quickly.) Then, look at your schedule and see how often you can spare that chunk of time. That’s your posting schedule.

Brainstorm posts in advance

Got your schedule decided upon? Now it’s time to make life easier on your future-self by brainstorming a boatload of post ideas at once.

Starting a blog can be intimidating because it’s hard to imagine that you’ll have things to write about on a regular basis. Having this master list of ideas that you can return to again and again is reassuring. It also makes it much easier to stick to your blogging schedule.

In addition to interesting topics, recently published papers, and personal updates on your research, some other easy wins can be found by repurposing stuff you’re doing in the rest of your life into “low-cost” posts. As computer scientist Matt Might explains,

The secret to low-cost academic blogging is to make blogging a natural byproduct of all the things that academics already do.

  • Doing an interesting lecture? Put your lecture notes in a blog post.
  • Writing a detailed email reply? “Reply to public” with a blog post.
  • Answering the same question a second time? Put it in a blog post.
  • Writing interesting code? Comment a snippet into a post.
  • Doing something geeky at home? Blog about what you learned.

Aim to come up with at least 50 post topics before moving onto the next step: writing headlines that will snag readers.

Write effective headlines

Headlines are your best way to get a piece of your readers’ limited attention bandwidth. Some keys to writing headlines that work, according to the blogging experts at Buffer:

  • Put the most compelling stuff in the first and last three words of your headline (research tells us that most readers will only absorb that much)
  • Keep your headlines to 50-ish characters or less, so it won’t get truncated by search engines
  • Use psychology to compel people to read your post (headlines that are surprising, ask questions, super-specific or follow these other principles are proven effective)

So what does this look like in reality? Here are some examples:

  • Why are vegans the best lab workers? (asks question, follows “6-word” principle, element of surprise)
  • 5 ways Mike Eisen’s dead wrong about Open Access (specific, follows “6-word” principle, element of surprise)
  • How I landed a postdoc gig without even trying (tells readers “how to”, piques curiosity)

A surefire way to keep your readers hooked, no matter what, is making sure your blog posts’ titles matches each’s content. If they’re too obtuse or “click-baity”, people will stop clicking through to read your blog.

Remember: practice makes perfect. Writing good headlines is hard work. That’s why people get paid to do it for a living! You’ll likely write and re-write a headline several times before you find one that resonates with you.

Make your posts more popular with images

Screen Shot 2014-11-09 at 10.24.12 AM.png

Images can help break up blocks of text, making your posts more readable (and thus more popular). And they also can help illustrate your points.

Aside from blogging images found in papers you’re reviewing or that you’ve created, my number one recommended place to find free images is the Flickr Creative Commons search (though sometimes there’s a lot of chaff that needs separating out). Buffer has also compiled a list of other free and public domain images you can use in your posts.

Learn about your readers

Screen Shot 2014-11-07 at 5.57.34 PM.png

Your final task is to set up an analytics service so you can learn about your readers.

Two popular options, Google Analytics and WordPress’s built-in statistics package, can tell you how many visitors your blog has received, what countries they’re coming from, what websites and search engines led them to your blog, what posts they’re reading, and much more.

Google Analytics, in particular, can be overwhelming to use–it’s a powerful tool that can seem like overkill for the novice. CUNY’s Academic Commons blog has a great starter guide to the service.

Homework

Your homework is deceptively simple: choose from among the blog topics you’ve brainstormed and write a post with a great headline.

Seriously–that’s it!

We’ll see you back here on Monday to talk about publication self-promotion platform Kudos.

Impact Challenge Day 6: Create an academic website

Screen Shot 2014-11-07 at 3.16.34 PM.png

Over the past five days, you’ve set up profiles on a variety of professional social networking platforms. Today, we’re going to create the hub that will bring them all together: a professional website.

You might already have a university-issued webpage, perhaps linked to your departmental website. They’re all right for showcasing basic information about you, but they often do your research a disservice.

Because of their rigid formatting and style requirements, you  often can’t link out to your full text publications, showcase scholarship that’s not shaped like an article, or add the number of articles and other scholarly products that best explains your career. And the other important things you do–teaching, mentoring, service, and so on? You often can’t showcase them at all.

Today, we’re going to help you create a flexible website that will easily bring together all of your identities. You’ll learn how to embed and automate content so you don’t have to constantly update your website. And we’ll get you started with recommendations for both DIY and “plug and play” website hosts that offer solid search engine optimization to–you guessed it–increase your “googleability.”

Choosing a hosting solution

If you’re lucky, your institution offers a free hosting solution. For those who don’t have access to free hosting, let’s cover your options.

Now, there are basic hosting solutions like Hostgator, Dreamhost, etc, but you’ll need to sling html to make them work. Here, we’ll focus on some solutions that offer a little more scaffolding out of the box.

Let’s start with the hosts that are easiest for novices to use.

Squarespace is an out-of-the-box hosting solution. You can code your own site or use their slick-looking design templates to create and customize your website. They’ve also got a built-in blogging platform–which will be useful for tomorrow’s challenge–and reportedly better SEO than other drag-and-drop website builders. The lowest tier of the service costs $10/month or $96/year. Example: Samuel N. Crane

WordPress.com-hosted sites are popular among academics. We’ll cover the platform in detail tomorrow, but it’s essentially a blogging platform that can be shoehorned into serving as a website. It offers good SEO, a simple-to-use interface, and out-of-the-box design “themes” that are as pretty (if not as easily customizable) as Squarespace’s. WordPress.com sites are free to create, but certain services like extra hosting space and domain name registration cost extra. Example: Joanna Dunlap

Github Pages is a popular hosting option for the tech-savvy researcher. If you’re already a user of the platform, Pages is a (relatively) simple solution. It allows for custom URLs and connects with a Markdown-enabled blogging platform called Jekyll (again, useful for tomorrow’s challenge). It’s free, which makes the 100 MB per file and 1 GB per repository space limits forgivable. Check out this guide to get started. Example: Ahmed Moustafa

Do some market research

Now that you’ve got a host for your website, your next job is to learn what makes an academic website great. Search for others in your discipline, academics in other fields, and even professionals who work outside of the Ivory Tower. The point is to find sites that you want to emulate for both design and content, make some mental notes about what makes them “work,” and maybe even bookmark them for later reference.

In addition to the examples we provided in the previous section, we recommend checking out these sites for some inspiration:

  • Christopher Madan: Chris is a postdoc at Boston College. This website is both visually appealing (great use of icons, photos, and formatting) and prominently includes important information about his career milestones (an “Intro to Matlab” book he wrote, links to publications and his CV, and a front-and-center bio that tells you what he’s all about).
  • Carly Strasser: Carly is a marine biologist turned Research Data Specialist with the California Digital Library. Her website works because it’s clean and simple, while making her expertise clear. She includes links to both papers and presentations, and also a prominent link to her blog–an important outreach tool.
  • Mike Brennan: Mike is an “alt-ac”–a researcher-turned-technologist and project lead at Second Muse. His website doesn’t have the slickest design, but it doesn’t matter. He nails his research career narrative by including front-and-center media coverage, links to publications and talks, and a list of awards. It’s easy to figure out how to contact him and links to personal photos and his record label give you a sense of his personality.

Got a sense of what a solid professional website looks like? Good, now let’s move on to what you should include in yours.

Essential components of a great professional website

As we’ve seen from Mike’s example, design is just aspect of your professional website. Let’s dig into the key types of content that you should include.

A short bio and recent photograph

Don’t use your bio to recount your entire career–that’s what your CV is for. Instead, be sure to state the most important thing about yourself first and foremost, and fill in the rest with broad strokes.

Who are you and what makes you tick as a researcher? What have your most important accomplishments been to date? Write a paragraph or two, then take a knife to it, cutting it down to bare essentials.

Want more advice on writing good bios? Guides to writing an effective bio can be found here and here.

And remember what we learned from yesterday’s challenge about good professional photos? Apply those guidelines to help you choose a good photograph for your website or, even better, just reuse the same photo from your LinkedIn profile.

Once you’ve got your bio and your photo ready to go, you’ll need to decide where to include it. I recommend keeping it simple by adding both to your homepage, but you can include them in a separate “About” or “Bio” page, instead.

Research interests

Now you’re going to tell others about your research. Your Research Interests page should be a punchier version of your Research Statement. If you’ve applied for a job or a promotion in the past few years, you likely have one handy.

The purpose of this section is to get others interested in your research, and help them understand how you’ve contributed to your discipline. You’ll describe what you’ve accomplished to date and what problems you’re currently working on.

Keep in mind that the Research Interests page should be much shorter than a formal Research Statement–no more than 2-3 paragraphs. Any longer and you risk losing your readers. Some jargon is acceptable in this section, but don’t go overboard–write as though you’re explaining your work to another academic who’s not in your discipline.

You might also choose to summarize some projects that you’ve most recently worked on (or for which you’re particularly well known) on this page. A paragraph or two per project is all that’s needed. Alternatively, you can break these descriptions out into a standalone Projects page.

Teaching & pedagogical materials

If you’re currently teaching or have taught in the past and want to highlight that experience, a Teaching page is the place to do it. List the courses you’ve taught, when you taught them, and include syllabi and any class materials here.

Similarly, if you want to highlight your mentoring activities or service to your field in their own standalone pages, you can do that, too.

Contact information

If others are interested in your work, how can they best reach you? Include both your current university contact information on this page and–most importantly–an email address that won’t easily go out of date if you switch institutions (your personal email address will work, if you’re comfortable listing it).

And because this is the 21st century–and you’re quickly becoming a very connected scholar–this is a good place to list links to your other profiles from across the web.

Your CV

The only thing more annoying than keeping your CV up-to-date is remembering to upload it to your website after you’ve changed it.

I’m going to share with you a super-efficient hack that made updating my CV downright pleasurable: embedding your CV in your website using Dropbox, so any changes you make automatically appear online.

If you don’t already have a Dropbox account, you can sign up for one here for free.

In Dropbox, copy a Word version of your CV into the “Public” folder. Make sure your CV is up-to-date, and then save it as a PDF.

On your website, create a separate webpage for your CV. Then, insert this code where you want the embedded PDF to appear:

<iframe style=”width: 610px; height: 850px;” src=”https://dl.dropboxusercontent.com/u/[URLHASH]/[CV FILENAME].pdf” frameborder=”1″ width=”320″ height=”240″></iframe>

The URL you’ll use can be found by right-clicking on your CV while in Dropbox, selecting “Copy Public Link,” and pasting it into the code above.

When all is said and done, you’ll have an embedded CV in your website that looks like this:

Screen Shot 2014-11-06 at 9.04.28 PM.png

And the best part is, whenever you need to update your CV, you can just update the Word file that’s in your Public Dropbox folder, re-save it (using the same filename) as a PDF, and the updated version will automatically appear on your website! Awesome, huh?

Your scholarship

Now that others have a sense of all the scholarly products you’ve ever created thanks to your CV, it’s time to get others access to your most important works.

On this page, you’ll list your publications, talks, data, software, and any other  scholarly products that you want to highlight. The purpose of this page isn’t to replicate what’s on your CV; it’s so your website’s visitors can get a 50,000 foot view of your quality as a scholar.

There are two popular ways to create pages for your scholarship: put everything you’ve ever created onto a page; or highlight only your best or most recent work. We’re going to take the latter approach, because it’s easier to maintain over time.

Copy your best scholarly works from your CV to this page. Include the full citation and a link to the resource itself, like so:

Screen Shot 2014-11-06 at 9.12.26 PM.png

Make it easy on your website visitors by listing no more than 20 products total.

An alternative approach to creating a standalone page for your scholarship is to create an Impactstory profile, which can capture all of your outputs, links to full-text, and their metrics into a single profile that’s embeddable into your website. Holly’s linked to her Impactstory profile from her website, as we see above. But more on that in an upcoming challenge!

Homework

First of all, take a deep breath. You have a website and that’s no small feat! Way to go!

Now let’s add links to the profiles you’ve created so far (Academia.edu, ResearchGate, Google Scholar, Mendeley, and LinkedIn).

You might also add Google Analytics to your site, so you can tell you how often your site is visited and by what demographics.

Next, decide if you want to register for a domain name. There’s a lot of reasons why you might want to do so, but I’m personally of the opinion that as long as you’ve got a unique name and good SEO, you don’t need to. If you do decide to register your own domain name, know that Squarespace offers free registration and WordPress allows you to register through their site for a fee. I’ve heard good things about third-party registrar Namecheap, too.

Finally, take some time to experiment. The beauty of owning your own website is the freedom it offers. I’d recommend playing around with automating updates to your website. One way is to embed an RSS feed for your blog or Twitter stream (if you already have them–if not, we’ll cover both soon). You could also embed a calendar that easily lets others know when you’re available during work hours (hopefully freeing you of scheduling agony in the future). Google, Outlook, and third-party app UpTo calendars are good candidates for that.

Day 6: Success!

Now that you’ve got a website, we’re going to get you a blog to go with it. It’s an indispensable tool for building expertise and recognition in your field. See you tomorrow!

Impact Challenge Day 5: make LinkedIn work for your research

Many academics used LinkedIn “just in case someone contacts them.” Our job today is to make your LinkedIn profile great enough that others will be eager to contact you. We’re also going to build out your network a bit, so others can see the high profile work you’ve done.

For today’s challenge, we’re going to:

  • Highlight your best work
  • Connect with other researchers
  • Create a profile that presents the best version of you and also doesn’t need a lot of regular maintenance

Step 1: Create a solid, low-maintenance profile

You want to create a profile that presents the very best version of you, and also doesn’t need a lot of regular maintenance. (Who has time for that?) You’ll do this by writing a headline and summary that makes it clear in general terms why you’re a smart and talented researcher and choosing a profile photo that’s both professional and inviting.

Make yourself memorable with a good headline

LinkedIn includes a short text blurb next to each person’s name in search results. They call this your “Headline,” and just like a newspaper headline, it’s meant to stimulate enough interest to make the reader want more.

Here are some keys to writing a great LinkedIn headline:

  1. Describe yourself with the right words: Brainstorm a few keywords that are relevant to the field you’re targeting. Spend a few minutes searching for others in your field, and borrowing from keywords found in their profiles and Headlines. For instance, check out Arianna C’s Headline: “Conceptual Modelling, Facilitation, Research Management, Research Networking and Matching”. Right away, the viewer knows what Arianna is an expert at. Your headline should do the same.

  2. Be succinct: Never use two words when one will do. (Hard for academics, I know. 🙂 ) Barbara K., who works in biotech, has a great Headline that follows this rule: “Microbiologist with R & D experience.”

  3. Show your expert status: What makes you the chemical engineer/genomics researcher/neuroscientist? Do you put in the most hours, score the biggest grants, or get the best instructor evaluations from students? This is your value proposition–what makes you great. Those with less experience like recent graduates can supplement this section by showing their passion for a topic. (I.e., “Computer scientist with a passion for undergraduate education.”)

  4. Use a tried and true formula to writing your headline: 3 keywords + 1 value proposition = Headline success, according to career coach Diana YK Chan. So what does that look like? Taking the keywords from (1) and value proposition from (3) above, we can create a Headline that reads, “Computer scientist with a passion for undergraduate education and experience in conceptual modelling and research management.” Cool, huh?

Well-written headlines are also key to making you more findable online–important for those of us who need disambiguation from similarly-named researchers beyond ORCID.

Make yourself approachable with the right photo

The next step to making yourself memorable to get a good photo on your profile. Here are three tips to remember:

  • Don’t tilt your head. Lots of folks, especially women, do this in photos to look more friendly, but it ends up making you look unassertive instead. Be confident.

  • Turn your shoulders; the straight-on post yells “mugshot.

  • Try posting an action shot, emphasizing for the viewer what you’re good at. A good example is this photo that demonstrates public speaking ability:

nsivwlP.png

Craft a compelling summary section

Your Summary is an opportunity to provide a 50,000 foot view into your career and studies to date. Don’t just use this section to repeat information found elsewhere on your profile. Instead, write a short narrative of your professional life and career aspirations, using some of the keywords left over from writing your Headline. When writing your Summary, aim to be specific and make your value clear.

Don’t use technical jargon, but do provide concrete details about your research and why it matters. Make yourself a person, not just another name in a discipline. Describe what you’ve done and why it matters.

Here’s a great example: Elizabeth Iorns, breast cancer researcher and entrepreneur, explains to profile viewers that:

“Based on her own experiences as a young investigator seeking expert collaborations, Dr. Iorns co-founded Science Exchange. In 2012, after recognizing the need to create a positive incentive system that rewards independent validation of results, Dr. Iorns created the Reproducibility Initiative.”

Right there is specific proof that she gets stuff done: she’s created solutions in response to service gaps for scientists. Impressive!

Step 2: Highlight your best work

Next, let’s prepare for making a good impression on your LinkedIn network by highlighting the work that’s most important to you. And you’re going to get others to notice it by making sure some of it’s eye-catching.

Brag about your best publications and awards

Consider your publications and awards the vegetables–the stuff you really want to be consumed. You’re going to make others notice them by listing them alongside the sweets–your eye-catching content.

You’ll want to highlight only your best publications (especially those where you’re a lead author) and most prestigious awards (i.e., skip the $500 undergraduate scholarship from your local Elks club). List no more than 5 total.

Here’s how to add them: in Edit Profile mode, you’ll see a “Recommended for you” panel to the right of your profile photo and header section. Click the “Publications” tile to add that section to your profile.

On the Publications section, you’ll need to manually add publication details. Here are the most important details to include:

  • Title (this one’s a no-brainer)
  • Publication URL (so others can click through to read your work)
  • Description (include your abstract in this space)

You can also add your co-authors, if they’re on LinkedIn and you’re already connected.

Now that your articles are added, drag the Publications section to appear just above or below any eye-catching content on your profile.

Add some eye-catching content

NsvQaut.png

With a little ingenuity you can make LinkedIn pretty good for showcasing what scientists have a lot of: posters, slide decks, and figures for manuscripts.

If you’ve ever given a talk at a conference, or submitted a figure with a manuscript for publication, you can upload it here, giving viewers a better taste of your work.

Neuroscientist Bradley Voytek has added a Wow Factor to his profile with a link to a TEDx talk he gave on his research. Pharmacology professor Ramy Aziz showcases his best conference talks using links to Slideshare slide decks. And Github repositories make an appearance alongside slide decks on postdoc Cristhian Parra’s profile (pictured above).

You too can upload links to your best–and most visually stimulating–work for a slick-looking profile that sets you apart from others. Here’s how: add links, photos, slideshows, and videos directly to your profile using the Upload icon on your profile’s Summary and Experience sections.

One caveat to adding content to your profile: LinkedIn does not offer analytics that show you how often your work is viewed or downloaded on the site. So, you’ll be unable to say with certainty what LinkedIn has done for your readership and so on, but that’s okay: LinkedIn is more about relationships and the boost they’ll give your reputation, instead. Read on.

Step 3: Connect with other researchers

Connecting with other researchers on LinkedIn is just one more way to build an audience for your research. Connections help you maintain relationships with past and current colleagues, who are likely interested in the work you’re doing and want to read about it.

Lu6DG0z.png

It’s surprisingly easy to find people you already know and add them to your network on LinkedIn.

Use the Add Connections tab in the top right corner of your profile to connect LinkedIn to your email account.

LinkedIn then suggests Connections based on your contacts. An important rule to follow for LinkedIn is to only select Connections you actually know and feel comfortable asking to keep in touch (former collaborators, co-workers, and friends are good choices).

When Connecting, it’s a nice touch to send a message saying hello. Networking is all about building meaningful relationships, not how many people you have in your virtual Rolodex.

Limitations

LinkedIn is a decent tool for professional visibility, but it’s not without its headaches. Chief among them is that it’s yet another information silo. (And that’s why you’re setting up a profile that’s going to be easy to maintain, so you don’t have to update it but once a year.) LinkedIn’s also overzealous with their notification emails, sending more in a month than most of us would care to receive in a year. Luckily, they’re easy to turn off; check out this blog post for a short-and-sweet how-to.

Homework

Add your best work

First things first: get at least three of your most important publications onto your profile, add some eye-catching content, then rearrange your profile sections so your Publications get prime real estate next to the most visually-stimulating pieces on your profile.

Make yourself more “googleable”

Next, you need to make it easy for others to view your profile. What good is a killer LinkedIn profile if no one can find it, or if your profile is so locked down they can only see your name?

Check your “public profile” settings (go to Privacy & Settings > Edit your public profile) to make sure people can see what you want them to. What might others want to see? Your past experience, summary, and education, for starters; also include your best publications.

Next, double-check your settings by signing out of LinkedIn completely and searching for yourself on both LinkedIn and Google.

Expand your network

Finally, let’s expand your network by requesting an introduction to a new contact. If done correctly, it can get you name recognition with important researchers.

Here’s an example of how that would work: I’m not currently Connected to genomics researcher Mike Eisen on LinkedIn, but let’s say I want to collaborate with him to do some research on a great idea I have.

The first thing I need to do to connect with him is find a contact that we have in common.

H7IeBkj.png

So, I visit Mike’s profile. On the left-hand side is a “How You’re Connected” graphic. I can scroll through the list of contacts we have in common to find a suitable middleman–Mendeley’s William Gunn.

Next, I would click on the “Ask William about Mike” link. In the dialog box that appears, I’d write my request for an introduction and send it to William. The request should follow three key rules:

Be specific

William might take 10 minutes out of his day to write a recommendation for me, so I shouldn’t waste his time. That means telling him exactly why I want to meet Mike: what Mike does that interests me (he’s a genomics researcher), and what I’m looking to get out of an introduction (an opportunity to tell him about my great research idea: widgets for genomics researchers).

Include a “pitch” as to why an introduction would be valuable

Likewise, I should make it clear what Mike would get out of meeting me. What do I bring to the table? In this case, it’d be the chance to learn about a well-received new widget, and a future NSF grant opportunity.

Show appreciation, and also provide William with an “easy out”

William’s time is valuable, so I should make it clear that I’m thankful that he’s considering writing an Introduction. A good way to do that in addition to saying thanks is to give him a way to beg off without feeling too guilty.

Two additional rules for special scenarios are: 1) If we didn’t know each other well, I’d want to remind William how we met, and 2) If William does introduce Mike and I, I should follow up with an update and thanks.

An example introduction request can be found on this blogpost.

One final note: keep your requests for introductions to “2nd degree connections”–that is, friends of friends–because your chances of getting a meaningful introduction to a stranger through a friend of a friend of a friend depends on too many variables to be successful.

Congrats, you’ve made it to the weekend!

gTNSX6N7vcKOY.gif

You’ve just completed the Day 5 challenge. Congrats! We’re very proud of you.

But don’t go anywhere just yet! We’ll be bringing you two challenges over the weekend: creating an effective website and starting a professional blog. See you tomorrow!

What’s our impact? (September & October 2014)

As a platform for users interested in data, we want to share some data-driven stories about our successes (and challenges) in spreading the word about Impactstory throughout September and October.

Here are our numbers for September and October 2014.

Organic site traffic

We saw a spike in traffic for August & September that’s unusual. It’s due to announcements we made about Impactstory’s changing business model, which became subscription based on September 15. October’s traffic is a return to pre-announcement levels.

  • Unique Visitors: 12,303 total
    • 4263 visitors in September
    • 3249 visitors in October
  • New Users: 748
  • Conversion rate: ~9.9% (% of visitors who signed up for a new user account)

Blog stats

  • Unique visitors: 13,077
    • 5866 visitors in September – up 33.9% from August
    • 7211 visitors in October – up 22.9% from September
  • Clickthrough rate: 2.01% total (% of people who visited Impactstory.org from the blog)
    • 2.4% in September
    • 1.6% in October
  • Conversion rate: 20.3% (9.8% for August) (% of visitors to impactstory.org from blog who signed up for an Impactstory.org account)
  • Percent of new user signups: 6.9% (1.8% for August)

Twitter stats

  • New followers 482 (215 for August)
  • Increase in followers from August 11.19%
    • 4.29% growth in Sept
    • 5.38% growth in Oct
  • Mentions 688 (346 for August) (We’re tracking this to answer the question, “How engaged are our followers?”)
  • Tweet reach 8,703,155 (3,543,827 for August) (We’re tracking this–the number of people who potentially saw a tweet mentioning Impactstory or our blog–to understand our brand awareness)
  • Referrals to Impactstory.org: 618 (271 for August)
  • Signups: 43 (32 for August)

What does it all mean?

Not all of these numbers are directly comparable, as they track growth over a 60 day period rather than a 30 day period, which is what our August numbers are based on.

  • Impactstory.org: Our conversion rates on Impactstory.org went down from August, meaning that the site design changes we enacted in September had a different effect than we anticipated. We’re continuing to roll out changes that will improve conversion rates in the coming months.

  • Blog: We’re continuing to write blogs that our users find worthy of sharing and reading, as evidenced by our double-digit readership growth throughout September and October. (Looks like we really nailed the content marketing goals we set for ourselves in the last post.) Our conversion rates went down from September to October, however, perhaps due to the fact that we didn’t blog about Impactstory much during October–meaning that new readers had little reason to click through and sign up for an Impactstory account. In addition to our November Impact Challenge, we’ll probably do more blogging in November about Impactstory itself.

  • Twitter: Our Twitter followers and mentions continue to grow at the same pace as in August, while our tweet reach grew slightly. That indicates that we’re doing about the same amount of engagement, while also writing tweets that our followers find more worthy of mentioning to others via retweets. We have yet to crack the 5,000 follower mark, meaning we missed our goal that we set for ourselves in August. We’re aiming meet that goal by the end of November, instead.

We’re going to continue to blog our progress over the next few months, while also keeping our eyes peeled for ways to share this data in a more automated fashion. If you have questions or comments, we welcome them in the comments below.

Updated 12/15/2014 and 12/31/2014 to fix a data reporting error in impactstory.org visits (previously reported values reflected total visitors, not unique visitors) and conversion rates for visitors to impactstory.org from blog.

Impact Challenge Day 4: Connect with other researchers on Mendeley.com

Next up for our Impact Challenge is Mendeley.

Are you surprised? While there was pushback against Mendeley after it was unexpectedly bought by Elsevier a few years ago, and it is marketed more as a reference manager than a social network, Mendeley remains popular with many academics and librarians. It offers ways to connect with other researchers that you can’t find on other platforms.

Mendeley Web (the online counterpart to the desktop reference management software) is similar to Google Scholar in several ways. What’s distinctive about Mendeley is that it offers better opportunities to interact with other researchers and get your research in front of communities that might be interested in it, in a context where they’re largely interacting with scholarship they intend to actually read and cite.

Moreover, Mendeley’s Readership Statistics can tell you a lot about the demographics that have bookmarked your work–an important indicator of who’s reading your work and who might cite it in the future.

We’re also going to talk in this post about Zotero, which is quite similar to Mendeley. We’re big supporters of Zotero because it’s an open-source non-profit, and we see that as a killer feature for science tools. However, although it really shines as a reference manager, Zotero’s community features are less powerful–mostly because they have less activity. So we’ll provide links and information on how to do some of these steps in Zotero, but not in as much detail.

Step 1: Create a profile

Logon to Mendeley.com and click the “Create a free profile” button. Create a login and, on the next screen, enter your general field of study and your academic status (student, professor, postdoc, etc).

As you advance to the next screen, beware: Mendeley Desktop will automatically start downloading to your computer. (You’ll need it to make the next step a bit easier on yourself, but you can also make do without it. Your call.) Download it and install it if you plan to use it for the next step–importing your publications.

Zotero alternative: Logon to Zotero.org, click “Register” in the upper right-hand corner, and register for an account. Once you’ve validated your new account, click your username in the upper right-hand corner (where it says, “Welcome, username!”) and then click on the “Edit Profile” link on the next screen to head to the Profile section of your Zotero settings. There, you can create a profile.

Step 2: Import your publications

If you didn’t install Mendeley Desktop, here’s how to add your references manually using Mendeley Web:

  • Click the “My Library” tab, then the “Add Document” icon.

  • On the “Add New Document” dialog box that appears, select “My Publications” from the “Add to” drop-down menu, then use the “Type” drop-down menu to specify what type of document you’re adding to your “My Publications” list (article, book section, thesis, etc).

  • The dialog box will automatically expand, giving you many fields to fill out with descriptive information for that publication. Complete as many as possible, so others can find your publication more easily. If an Open Access link to the full-text of your publication exists, provide it in the URL box. And be sure to add a DOI, if you’ve got one. Click “Save” when finished.

  • Rinse and repeat as necessary, until all your articles are added to your profile.

If you’ve got Mendeley Desktop installed, your job is much easier. Export your publications in .bib format from Google Scholar (which we covered in yesterday’s challenge), and then:

  • Fire up Desktop and select “My Publications” from the “My Library” panel in the upper left corner of the screen.

  • Click File > Import > BibTeX (.bib) on the main menu.

  • On your computer, find the citations.bib file you exported from Google Scholar, select it, and click “Open”. Mendeley will begin to import these publications automagically.

  • In the dialog box that appears, confirm that you are the author of the documents that you’re importing, and that you have the rights to share them on Mendeley. Click “I agree.”

  • Click the “Sync” button at the top of the Desktop screen to Sync your local Mendeley library with your Mendeley Web library.

That’s it! You’ve just added all your publications to your Mendeley profile. And you know how to add any missing publications that didn’t auto-import, to boot.

Here’s what your profile page will look like, now that you’ve added publications to your My Publications library:

Screen Shot 2014-11-04 at 9.12.32 PM.png

Zotero alternative: to auto-import your publications from a BiBTeX file, follow these instructions. To manually add publications, follow these instructions.

Step 3: Follow other researchers

Now you’re ready to connect with other researchers. Consider this step akin to introducing yourself at a conference over coffee: informal, done in passing, and allowing others to put a face to a name.

First, you’ll need to find others to follow. Search for colleagues or well-known researchers in your field by name from the Mendeley search bar in the upper right-hand screen of Mendeley Web:

Screen Shot 2014-11-04 at 9.17.39 PM.png

Be sure to select “People” from the drop-down menu, so you search for profiles and not for papers that they’ve authored.

When you find their profile, click on their name in the search results, and then click the “Follow” button on the right-hand side of the profile:

Screen Shot 2014-11-04 at 9.20.56 PM.png

That’s it! Now you’ll receive updates on your Mendeley homepage when they’ve added a new publication to their profile or done something else on the site, like join a group.

Zotero alternative: Zotero works in a very similar way. Search for your colleague, find their profile, and click the red “Follow” button at the top-right of their profile to begin following them.

Step 4: Join groups relevant to your research

If Step 3 was like introducing yourself during a conference coffee break, Step 4 is like joining a “Birds of a Feather” group over lunch, to talk about common interests and get to know each other a bit better.

Screen Shot 2014-11-04 at 9.27.13 PM.png

Mendeley groups are places where researchers interested in a common topic can virtually congregate to post comments and share papers. It’s a good place to find researchers in your field who might be interested in your publications. And it’s also the single best place on the platform to learn about work that’s recently been published and is being talked about in your discipline.

To find a group, search for a subject using the search toolbar you used for Step 3, making sure to select “Groups” from the drop-down menu. Look through the search results and click through to group pages to determine if the group is still active (some groups were abandoned long-ago).

If so, join it! And then sit back and enjoy all the new knowledge that your fellow group members will drop on you in the coming days, which you can view from either the group page or your Mendeley homescreen.

And you can feel free to drop some knowledge on them, too. Share your articles, if relevant to the group’s scope. Pose questions and answer others’ questions. Openly solicit collaborators if you’ve got an interesting project in the pot that you need help on, like Abbas here has:

Screen Shot 2014-11-04 at 9.43.54 PM.png

Use groups like you would any other professional networking opportunity: as a place to forge new connections with researchers you might not have a chance to meet otherwise.

Zotero alternative: Zotero works in a very similar way. Search for a group topic, find a group you want to join, and click the red “Join Group” button at the top of the page.

Step 5: Learn who’s bookmarking your work

Once your work is on Mendeley, you can learn some basic information about who’s saving it in their libraries via Mendeley’s Readership Statistics. And that’s interesting to know because Mendeley bookmarks are a leading indicator for later citations.

To see the readership demographics for your publications, head to the article’s page on Mendeley. On the right side of the screen, you’ll see a small Readership Statistics panel:

Screen Shot 2014-11-04 at 9.58.08 PM.png

Readership Statistics can tell you how many readers you have on Mendeley (meaning, how many people have bookmarked your publication), what discipline they belong to, their academic status, and their country. Very basic information, to be sure, but it’s definitely more than you’d know about your readers if you were looking at the number of readers alone.

Zotero alternative: Zotero doesn’t yet offer readership statistics or any other altmetrics for publications on their site, but they will soon. Stay tuned!

Limitations

Perhaps the biggest limitation to Mendeley is their association with Elsevier. Mendeley was acquired by the publishing behemoth in early 2013, while the ghastly, Elsevier-backed Research Works Act fail was still fresh in many academics’ minds.

As danah boyd points out, even after Elsevier dropped support for the RWA and the “#mendelete” fracas ended, Elsevier was (and is) still doing a lot that’s not researcher-friendly. And yet, some of us continue to eat at McDonald’s knowing what goes into their chicken nuggets. Like any big organization, Elsevier does some stuff right and some stuff wrong, and it’s up to researchers to decide how it all balances out; there’s lots of room for reasonable folks to disagree. For what it’s worth: at Impactstory, one of us is a Zotero early adopter and code-contributor, one of us has switched from Mendeley to Zotero, and one of us uses both 🙂

Drawbacks to the platform itself? You can’t easily extract readership information for your publications unless you use Mendeley’s open API (too high a barrier for many of us to pass). So, you’ll need to cut-and-paste that information into your website, CV, or annual review, just as you would when using Google Scholar. (It’s relatively easy to extract readership numbers using third-party services like Impactstory, on the other hand. More on that in the days to come.)

A final drawback: if you want to add new publications, you’ll have to do it yourself. Mendeley doesn’t auto-add new publications to your profile like Google Scholar or other platforms can.

Homework

First, complete your profile by manually adding any works that the BibTeX import from Google Scholar didn’t catch.

Next, build your network by following at least five other researchers in your field, and joining at least two groups. On each of the groups you’ve joined, share at least one publication, whether it’s one you’ve authored or one written by someone else. Remember, make sure they’re relevant to the group, or else you’ll be pegged as a spammer.

Over the next few days, log onto Mendeley Web (or Zotero Web) at least one more time, and become acquainted with your homescreen timeline to stay abreast of new research that’s been added to groups or your colleagues’ profiles.

Finally, learn how to export your publications–and the rest of your library–from Mendeley, so you don’t have to reinvent the wheel attempting to set up a profile for your publications on another platform. Here’s how to get your library out of Mendeley in BibTeX format:

  • In Mendeley Desktop, select all publications you want to export.

  • From the main menu, click File > Export.

  • In the dialog box that appears, choose BibTeX from the drop-down menu, rename your bibliography if you want, and choose a safe place to store the .bib file. Click “Save” and you’re done!

Are you hangin’ in there?

You’ve now completed your Day 4 challenge, meaning you’re over halfway finished with Week 1, and over 10% finished with the entire month. That’s some free math, from us to you 🙂

X7GsMZcVH1erS.gif

Tomorrow, we’ll master LinkedIn. Get ready!