We recently announced that we’d completely rewritten Unpaywall to make it faster, more accurate, and (most importantly) easier to fix and improve. We wanted to move Unpaywall from product to process, something we could continuously improve along with the community.
Well, we’ve been working hard on that over the last few months and here’s an update!
Better Gold coverage
By far the most common OA color is gold. In fact, based on our manual sampling, 25% of Crossref DOIs are gold OA, which is much higher than I’d expected and much higher than it used to be. (note: in this and all following stats we exclude component DOIs, which aren’t indexed in Unpaywall).
Coverage of gold is very tricky, because it’s all about the status of the work’s source, not the work itself. So we need very comprehensive coverage of sources, which is as hard as it sounds.
Of course there’s DOAJ which is fantastic but they only cover a small subset of gold OA journals. And even for those journals, DOAJ often only tells us that a given journal is fully OA since a certain date—we still need to figure out if the back catalog is open or not.
In recent weeks, we’ve finished several projects to add the “this is gold OA” flag to new journals:
- We crawled 50k OJS journals, adding gold status to 17,000 of them (many thanks to Juan Pablo Alperin and Diego Chavarro for their help in getting a list of OJS journals!)
- We marked 1,200 new journals gold using data from J-STAGE.
- We marked 100 new journals gold using data from SciELO
- We added gold status to several dozen journals from fully-OA publishers including including MDPI, Academic Journals, and Edorium.
We also modified our algorithm to assign gold instead of bronze when we know an article is OA, but we can’t figure out its source. Since gold is 2.5x more common than bronze, this will result in fewer errors overall.
Overall, this has made a big change in our gold coverage: now 19% of Unpaywall is gold, compared to 14% in May.
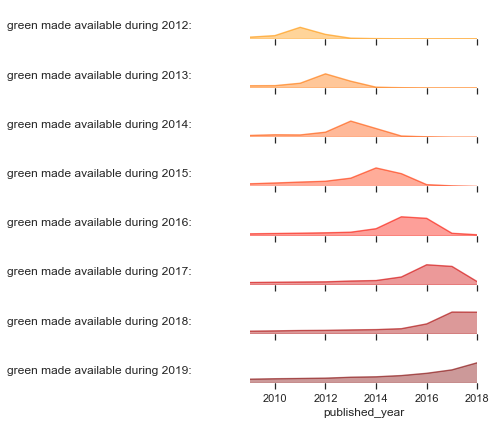
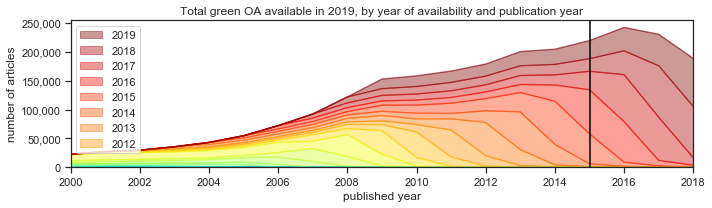
Green OA
We’ve made several changes in our green OA approach. These have not increased our total green percentage, but they have made our assignment of colors more consistent.
The rule for green has always been that if the best OA location is in a repository, it’s green. But, like gold, this is very dependent on us correctly describing the source as a repository. We’re very good at this for institutional repositories—but we’ve not been so good for preprint and data repositories, which are both much more common today then they were when we started Unpaywall.
Other changes
We fixed a bug causing us to list works published under the Elsevier User License as Hybrid. Since we don’t consider that to be an OA license, we moved these to bronze.
We marked SSRN as an open repository…it’s on the bubble but since all works are available free right away, for us it counts.
Results

The “ground truth” dataset is a random sample of 500 DOIs from Crossref. It excludes component DOIs and DOIs that don’t resolve. Each DOI is manually annotated by our team, which often includes doing lots of research on the journals and repositories that host the content. The definitions of oa_status colors come from here, which is in turn based on the original 2018 Unpaywall paper in PeerJ.
As you can see, we’re moving in the correct direction when it comes to gold and hybrid, green isn’t changing, and bronze coverage is going backwards a bit, although it’s still pretty close to the ground truth number. Our roadmap will prioritize green and gold for the next few months at least.
The future
The most important change for Unpaywall moving forward is the upcoming rewrite of OpenAlex, which will be gradually rolled out October-November of this year. That’s because when this rewrite is deployed, OpenAlex and Unpaywall will finally share the exact same codebase. Of course this will eliminate those pesky, embarrassing bugs where Unpaywall and OpenAlex disagree. But more importantly, it’ll link the large Unpaywall and OpenAlex communities, allowing everyone to improve both products together.
Even before that, though, we’ll be unveiling another exciting change: a new and improved curation portal. This will make it easier to fix article-level bugs in Unpaywall, including bugs that current curation solution doesn’t address (like missing PDF URLs and incorrect licenses). Even cooler, though it’ll allow users to fix source-level bugs, particularly fixing journals that should be marked gold, but aren’t. Although someday AI might let us automate this, for now, we think that active community curation is the only viable way to keep that data accurate and up to date. The unification of OpenAlex and Unpaywall codebases means that all these changes will propagate to both systems within days.
Ok, that’s all for now! Thanks for your support and as always, please get in touch with any suggestions or feedback!