Green OA lag

Ok I know for maximum impact we should probably spread all these blog posts out over multiple days, but I’m way too eager to share — I think people interested in Green OA will be really interested in this, I know I am.

It’s from the supplementary information section of the preprint, Section 11.1:

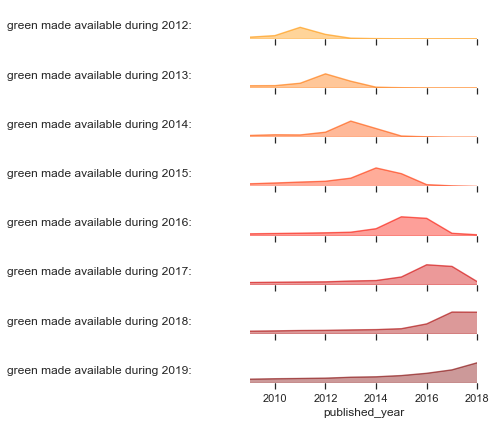
In the figure below we plot the number of Green OA papers made available each year vs their date of publication. The first plot is a histogram of number of papers made available each year (one row for each year).

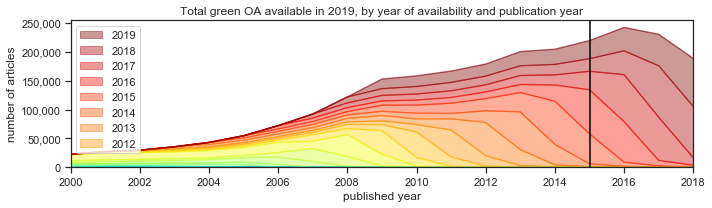
The next plot is the same, but superimposes the articles made available in previous years. This stacked area represents the total cumulative number of Green OA papers that are available in that year — if you were in that year and wondering what was available as Green OA that’s what you’d find.

The third plot is a larger version of the availability as of 2018, showing the accumulation of availability. It allows us to appreciate that less than half of papers papers published in, say, 2015, were made available the same year — most of the papers have been made available in subsequent years. The fourth plot is a slice in isolation, for clarity: the Green OA for articles with a Publication Date of 2015.

Again, this last plot is when articles that were published in 2015 were actually made available in repositories. As you can see at the bottom of the stacked bar, a very few articles that were published in 2015 were actually posted in a repository in 2014. Those are preprints. A lot of articles published in 2015 appeared in a repository in 2015, but even more had a delay and didn’t appear in a repository until 2016. A full 40% of articles had an OA lag of more than a year, including some with an OA lag of four years!

More details on data collection are in the paper — just wanted to dig this out of Supplementary Information so that fellow nerds who’d enjoy this data don’t miss it 🙂

The Future of OA: what did we find?

Here are some of the key findings from the recent preprint on the Future of OA:

  • By 2025 we predict that 70% of all article views will be to articles available as OA — only 30% of article view attempts will be to content available only via subscription.
    • This compares to 52% of views available as OA right now, so it’ll be a big change in the next five years.
  • The numbers of Green, Gold, and Hybrid articles have been growing exponentially, and growing faster than Delayed OA or Closed access articles:
    • articles by year of observation, with exponential best fit line:
  • The average Green, Gold, and Hybrid paper receives more views than its Closed or Bronze counterpart, particularly Green papers made available within a year of publication.
    • views per article, by age of article:
  • Most Green OA articles become OA within their first two years of publication, but there is a long tail.
    • articles made newly Green OA in each the last four years, histograms by year of publication:
  • One interesting realization from the modeling we’ve done is that when the proportion of papers that are OA increases, or when the OA lag decreases, the total number of views increase — the scholarly literature becomes more heavily viewed and thus more valuable to society. This is intuitive, but could be explored quantitatively in future work using this model or ones like it.

Anyway, there are more findings too, but those are some of the main ones.

New perspective for OA: Date of Observation

We’d like to share one of the fun parts of our recent preprint. It’s fun because the concept of Date of Observation helps to untangle issues around embargoes — and also because we think we came up with a neat way to explain what is otherwise a fairly complicated concept, and hopefully make it accessible to everybody.

See what you think — here is our description of the Date of Observation, from section 3.3 of the preprint:

Let’s imagine two observers, Alice (blue) and Bob (red), shown by the two stick figures at the top of the figure:

Alice lives at the end of Year 1–that’s her “Date Of Observation.” Looking down, she can see all 8 articles (represented by solid colored dots) published in Year 1, along with their access status: Gold OA, Green OA, or Closed. The Year of Publication for all eight of these articles is Year 1.

Alice likes reading articles, so she decides to read all eight Year 1 articles, one by one.

She starts with Article A. This article started its life early in the year as Closed. Later that year, though–after an OA Lag of about six months–Article A became Green OA as its author deposited a manuscript (the green circle) in their institutional repository. Now, at Alice’s Date of Observation, it’s open! Excellent. Since Alice is inclined toward organization, she puts Article A article in a stack of Green articles she’s keeping below.

Now let’s look at Bob. Bob lives in Alice’s future, in Year 3 (ie, his “Date of Observation” is Year 3). Like Alice, he’s happy to discover that Article A is open. He puts it in his stack of Green OA articles, which he’s further organized by date of their publication (it goes in the Year 1 stack).

Next, Alice and Bob come to Article B, which is a tricky one. Alice is sad: she can’t read the article, and places it in her Closed stack. Unbeknownst to poor Alice, she is a victim of OA Lag, since Article B will become OA in Year 2. By contrast, Bob, from his comfortable perch in the future, is able to read the article. He places it in his Green Year 1 stack. He now has two articles in this stack, since he’s found two Green OA articles in Year 1.

Finally, Alice and Bob both find Article C is closed, and place it in the closed stack for Year 1. We can model this behavior for a hypothetical reader at each year of observation, giving us their view on the world–and that’s exactly the approach we take in this paper.

Now, let’s say that Bob has decided he’s going to figure out what OA will look like in Year 4. He starts with Gold. This is easy, since Gold article are open immediately upon publication, and publication date is easy to find from article metadata. So, he figures out how many articles were Gold for Alice (1), how many in Year 2 (3), and how many in his own Year 3 (6). Then he computes percentages, and graphs them out using the stacked area chart at the bottom of the figure. From there, it’s easy to extrapolate forward a year.

For Green, he does the same thing–but he makes sure to account for OA Lag. Bob is trying to draw a picture of the world every year, as it appeared to the denizens of that world. He wants Alice’s world as it appeared to Alice, and the same for Year 2, and so on. So he includes OA Lag in his calculations for Green OA, in addition to publication year. Once he has a good picture from each Date Of Observation, and a good understanding of what the OA Lag looks like, he can once again extrapolate to find Year 4 numbers.

Bob is using the same approach we will use in this paper–although in practice, we will find it to be rather more complex, due to varying lengths of OA Lag, additional colors of OA, and a lack of stick figures.

The Future of OA: A large-scale analysis projecting Open Access publication and readership

We are excited to announce our most recent study has just been posted on bioRxiv:

Piwowar, Priem, Orr (2019) The Future of OA: A large-scale analysis projecting Open Access publication and readership. bioRxiv: https://doi.org/10.1101/795310

This is the largest, most comprehensive analysis ever to predict the future of Open Access. Importantly, we look not only at publication trends but also at *viewership* — what do people want to read, and how much of it is OA?

The abstract is included below, we’ll be highlighting a few of the cool findings in subsequent blog posts, and you can read the full paper here (DOI not resolving yet). All the raw data and code is available, as is our style: http://doi.org/10.5281/zenodo.3474007. Enjoy, and let us know what you think!


Understanding the growth of open access (OA) is important for deciding funder policy, subscription allocation, and infrastructure planning.

This study analyses the number of papers available as OA over time. The models includes both OA embargo data and the relative growth rates of different OA types over time, based on the OA status of 70 million journal articles published between 1950 and 2019.

The study also looks at article usage data, analyzing the proportion of views to OA articles vs views to articles which are closed access. Signal processing techniques are used to model how these viewership patterns change over time. Viewership data is based on 2.8 million uses of the Unpaywall browser extension in July 2019.

We found that Green, Gold, and Hybrid papers receive more views than their Closed or Bronze counterparts, particularly Green papers made available within a year of publication. We also found that the proportion of Green, Gold, and Hybrid articles is growing most quickly.

In 2019:

  • 31% of all journal articles are available as OA
  • 52% of all article views are to OA articles

Given existing trends, we estimate that by 2025:

  • 44% of all journal articles will be available as OA
  • 70% of all article views will be to OA articles

The declining relevance of closed access articles is likely to change the landscape of scholarly communication in the years to come.


Additional blog posts about this paper:

Podcast episode about Unpaywall


I recently had a fun conversation with @ORION_opensci for their just-launched podcast.

The episode is about half an hour long, and covers what @Unpaywall is, who uses it, how it came about, a bit about how it works, thoughts on the importance of #openinfrastructure, the sustainability model, how open jives with getting money from Elsevier, #PlanS, how to help the #openscience revolution…

Anyway, here’s where you can listen (you can either load it into your Podcast app, or just press “play” on the webpage player):

https://orionopenscience.podbean.com/e/scaling-the-paywall-how-unpaywall-improved-open-access/

(Or here’s the MP3.)

Thanks for having me @OOSP_ORIONPod, it was super fun!  And do check out the rest of the episodes as well, they are covering great topics:


Introducing oaDOI: resolve a DOI straight to OA


Most papers that are free-to-read are available thanks to “green OA” copies posted in institutional or subject repositories.  The fact these copies are available for free is fantastic because anyone can read the research, but it does present a major challenge: given the DOI of a paper, how can we find the open version, given there are so many different repositories?screen-shot-2016-10-25-at-9-07-11-am

The obvious answer is “Google Scholar” 🙂  And yup, that works great, and given the resources of Google will probably always be the most comprehensive solution.  But Google’s interface requires an extra search step, and its data isn’t open for others to build tools on top of.

We made a thing to fix that.  Introducing oaDOI:

We look for open copies of articles using the following data sources:

  • The Directory of Open Access Journals to see if it’s in their index of OA journals.
  • CrossRef’s license metadata field, to see if the publisher has reported an open license.
  • Our own custom list DOI prefixes, to see if it’s in a known preprint repository.
  • DataCite, to see if it’s an open dataset.
  • The wonderful BASE OA search engine to see if there’s a Green OA copy of the article. BASE indexes 90mil+ open documents in 4000+ repositories by harvesting OAI-PMH metadata.
  • Repository pages directly, in cases where BASE was unable to determine openness.
  • Journal article pages directly, to see if there’s a free PDF link (this is great for detecting hybrid OA)

oaDOI was inspired by the really cool DOAI.  oaDOI is a wrapper around the OA detection used by Impactstory. It’s open source of course, can be used as a lookup engine in Zotero, and has an easy and powerful API that returns license data and other good stuff.

Check it out at oadoi.org, let us know what you think (@oadoi_org), and help us spread the word!

What’s your #OAscore?


We’re all obsessed with self-measurement.

We measure how much we’re Liked online. We measure how many steps we take in a day. And as academics, we measure our success using publication counts, h-indices, and even Impact Factors.

But we’re missing something.

As academics, our fundamental job is not to amass citations, but to increase the collective wisdom of our species. It’s an important job. Maybe even a sacred one. It matters. And it’s one we profoundly fail at when we lock our work behind paywalls.

Given this, there’s a measurement that must outweigh all the others we use (and misuse) as researchers: how much of our work can be read?

This Open Access Week, we’re rolling out this measurement on Impactstory. It’s a simple number: what percentage of your work is free to read online? We’d argue that it’s perhaps the most important number associated with your professional life (unless maybe it’s the percentage of your work published with a robust license that allows reuse beyond reading…we’re calculating that too). We’re calling it your Open Access Score.

We’d like to issue a challenge to every researcher: find out your open access score, do one thing to raise it, and tell someone you did. It takes ten minutes, and it’s a concrete thing you can do to be proud of yourself as a scholar.

Here’s how to do it:

  1. Make an Impactstory profile. You’ll need a Twitter account and nothing more…it’s free, nonprofit, and takes less than five minutes. Plus along the way you’ll learn cool stuff about how often your research has been tweeted, blogged, and discussed online.
  2. Deposit just one of your papers into an Open Access repository. Again: it’s easy. Here’s instructions.
  3. Once you’re done, update your Impactstory, and see your improved score.
  4. Tweet it. Let your community know you’ve made the world a richer, more beautiful place because you’ve made you’ve increased the knowledge available to humanity. Just like that. Let’s spread that idea.

Measurement is controversial. It has pros and cons. But when you’re measuring the right things, it can be incredibly powerful. This OA Week, join us in measuring the right things. Find your #OAscore, make it better, tweet it out. If we’re going to measure steps, let’s make them steps that matter.


Crossposted on the Open Access Week blog.

Now, a better way to find and reward open access


There’s always been a wonderful connection between altmetrics and open science.

Altmetrics have helped to demonstrate the impact of open access publication. And since the beginning, altmetrics have excited and provoked ideas for new, open, and revolutionary science communication systems. In fact, the two communities have overlapped so much that altmetrics has been called a “school” of open science.

We’ve always seen it that way at Impactstory. We’re uninterested in bean-counting. We are interested in setting the stage for a second scientific revolution, one that will happen when two open networks intersect: a network of instantly-available diverse research products and a network of comprehensive, open, distributed significance indicators.

So along with promoting altmetrics, we’ve also been big on incentives for open access. And today we’re excited that we got a lot better at it.

We’re launching a new Open Access badge, backed by a really accurate new system for automatically detecting fulltext for online resources. It finds not just Gold OA, but also self-archived Green OA, hybrid OA, and born-open products like research datasets.

A  lot of other projects have worked on this sticky problem before us, including the Open Article Gauge, OACensus, Dissemin, and the Open Access Button. Admirably, these have all been open-source projects, so we’ve been able to reuse lots of their great ideas.

Then we’ve added oodles of our own ideas and techniques, along with plenty of research and testing. The result? Impactstory is now the best, most accurate way to automatically assess openness of publications. We’re proud of that.

And we know this is just the beginning! Fork our code or send us a pull request if you want to make this even better. Here’s a list of where we check for OA to get you started:

  • The Directory of Open Access Journals to see if it’s in their index of OA journals,
  • CrossRef’s license metadata field,  to see if the publisher has uploaded an open license.
  • Our own custom list DOI prefixes, to see if it’s in a known preprint repo
  • DataCite, to see if it’s an open dataset.
  • The wonderful BASE OA search engine to see if there’s a Green OA copy of the article.
  • Repository pages directly, in cases where BASE was unable to determine openness.
  • Journal article pages directly, to see if there’s a free PDF link (this is great for detecting hybrid OA)

What’s it mean for you? Well, Impactstory is now a powerful tool for spreading the word about open access. We’ve found that seeing that openness badge–or OH NOES lack of a badge!–on their new profile is powerful for a researcher who might otherwise not think much about OA.

So, if you care about OA: challenge your colleagues to go make a free profile and see how open they really are. Or you can use our API to learn about the openness of groups of scholars (great for librarians, or for a presentation to your department). Just hit the endpoint http://impactstory.org/u/someones_orcid_id to find out the openness stats for anyone.

Hit us up with any thoughts or comments, and enjoy!